时间序列预测可能具有挑战性,因为您可以使用许多不同的方法,并且每种方法都有许多不同的超参数。
Prophet 库是一个开源库,专为预测单变量时间序列数据集而设计。它易于使用,旨在自动找到一组良好的模型超参数,以默认情况下就具有趋势和季节性结构的数据进行有技能的预测。
在本教程中,您将了解如何使用 Facebook Prophet 库进行时间序列预测。
完成本教程后,您将了解:
- Prophet 是由 Facebook 开发的开源库,专为单变量时间序列数据的自动预测而设计。
- 如何拟合 Prophet 模型并使用它们进行样本内和样本外预测。
- 如何在保持的数据集上评估 Prophet 模型。
让我们开始吧。

在 Python 中使用 Prophet 进行时间序列预测
照片由 Rinaldo Wurglitsch 拍摄,保留部分权利。
教程概述
本教程分为三个部分;它们是:
- Prophet 预测库
- 汽车销售数据集
- 加载并汇总数据集
- 加载并绘制数据集
- 使用 Prophet 预测汽车销售
- 拟合 Prophet 模型
- 进行样本内预测
- 进行样本外预测
- 手动评估预测模型
Prophet 预测库
Prophet,或称“Facebook Prophet”,是由 Facebook 开发的用于单变量(一个变量)时间序列预测的开源库。
Prophet 实现了一种他们称之为 加性时间序列预测模型 的方法,并且该实现支持趋势、季节性和节假日。
实现了一种基于加性模型的时序数据预测方法,其中非线性趋势拟合了年度、周度和日度季节性以及节假日效应。
— Package ‘prophet’, 2019。
它旨在易于使用且完全自动化,例如,将其指向时间序列即可获得预测。因此,它用于内部公司用途,例如预测销售、容量等。
有关 Prophet 及其功能的精彩概述,请参阅文章
- Prophet:大规模预测, 2017.
该库提供了 R 和 Python 两种接口。本教程将重点关注 Python 接口。
第一步是使用 Pip 安装 Prophet 库,如下所示
|
1 |
sudo pip install fbprophet |
接下来,我们可以确认库已正确安装。
为此,我们可以在 Python 中导入该库并打印版本号。完整的示例列于下方。
|
1 2 3 4 |
# 检查 prophet 版本 import fbprophet # 打印版本号 print('Prophet %s' % fbprophet.__version__) |
运行示例将打印已安装的 Prophet 版本。
您应该拥有相同或更高的版本。
|
1 |
Prophet 0.5 |
现在我们已经安装了 Prophet,让我们选择一个数据集来探索使用该库。
汽车销售数据集
我们将使用月度汽车销售数据集。
这是一个标准的单变量时间序列数据集,包含趋势和季节性。该数据集包含 108 个月的数据,并且简单的持久预测可以实现约 3,235 辆车的平均绝对误差,提供了一个较低的误差限。
无需下载数据集,因为我们将在每个示例中自动下载。
加载并汇总数据集
首先,让我们加载并汇总数据集。
Prophet 要求数据为 Pandas DataFrames。因此,我们将使用 Pandas 加载和汇总数据。
我们可以通过调用 read_csv() Pandas 函数 直接从 URL 加载数据,然后汇总数据的形状(行数和列数)并查看前几行数据。
完整的示例如下所示。
|
1 2 3 4 5 6 7 8 9 |
# 加载汽车销售数据集 from pandas import read_csv # 加载数据 path = 'https://raw.githubusercontent.com/jbrownlee/Datasets/master/monthly-car-sales.csv' df = read_csv(path, header=0) # 总结形状 print(df.shape) # 显示前几行 print(df.head()) |
运行示例将首先报告行数和列数,然后列出前五行数据。
我们可以看到,正如我们所预期的,有 108 个月的数据和两列。第一列是日期,第二列是销售量。
请注意,输出中的第一列是行索引,不是数据集的一部分,只是 Pandas 用于排序行的有用工具。
|
1 2 3 4 5 6 7 |
(108, 2) Month Sales 0 1960-01 6550 1 1960-02 8728 2 1960-03 12026 3 1960-04 14395 4 1960-05 14587 |
加载并绘制数据集
除非我们绘制出来,否则时间序列数据集对我们来说没有意义。
绘制时间序列有助于我们实际看到是否存在趋势、季节性周期、异常值等。它能让我们对数据有感觉。
我们可以通过在 DataFrame 上调用 plot() 函数轻松地在 Pandas 中绘制数据。
完整的示例如下所示。
|
1 2 3 4 5 6 7 8 9 |
# 加载并绘制汽车销售数据集 from pandas import read_csv from matplotlib import pyplot # 加载数据 path = 'https://raw.githubusercontent.com/jbrownlee/Datasets/master/monthly-car-sales.csv' df = read_csv(path, header=0) # 绘制时间序列 df.plot() pyplot.show() |
运行示例将创建时间序列图。
我们可以清楚地看到随时间推移的销售趋势以及销售的月度季节性模式。这些是我们期望预测模型考虑的模式。
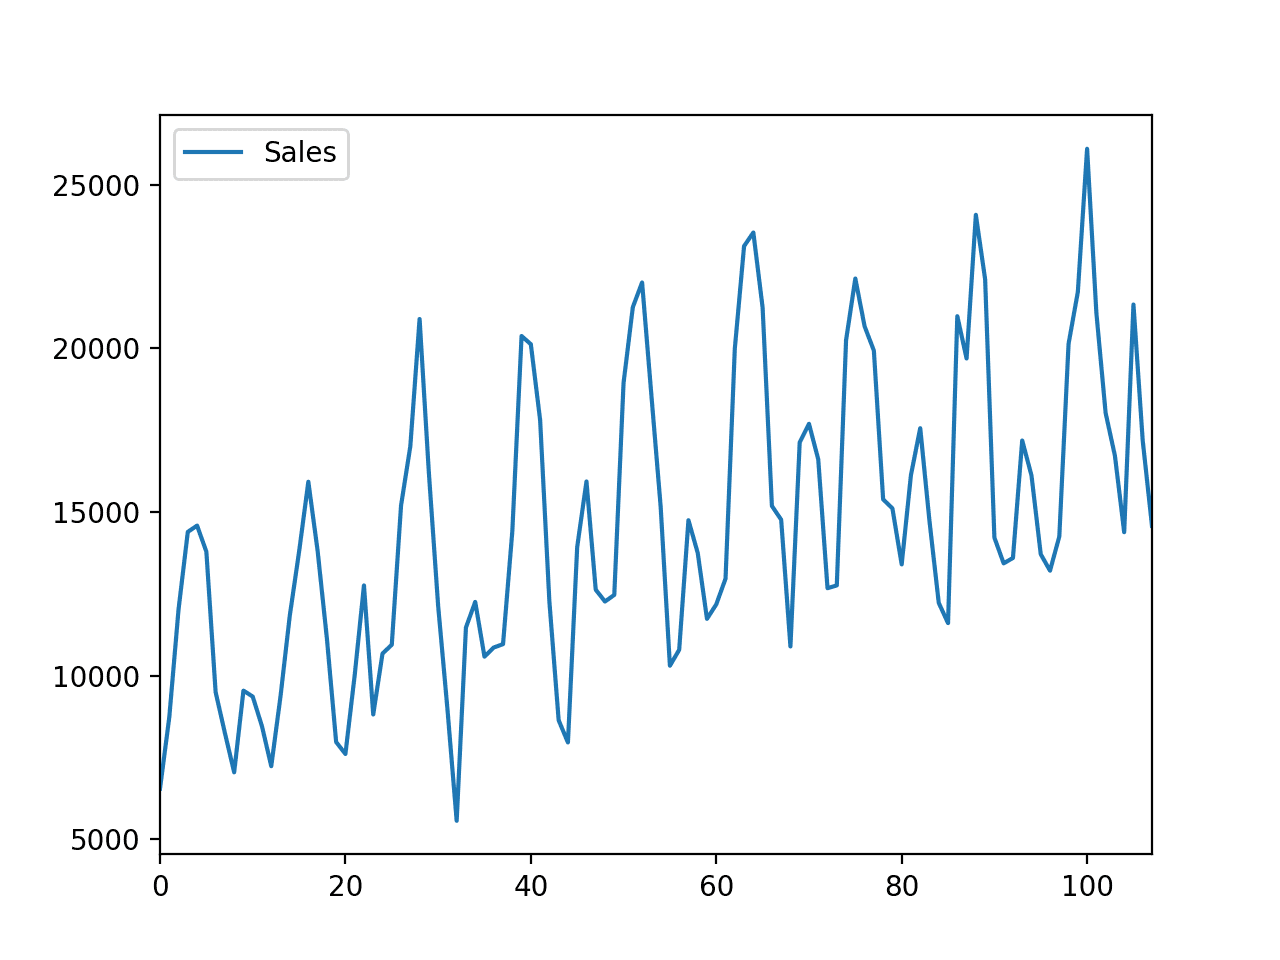
汽车销售数据集的线图
现在我们熟悉了数据集,让我们探索如何使用 Prophet 库进行预测。
使用 Prophet 预测汽车销售
在本节中,我们将探索使用 Prophet 预测汽车销售数据集。
让我们从拟合模型开始
拟合 Prophet 模型
要使用 Prophet 进行预测,首先,需要定义和配置一个 Prophet() 对象,然后通过调用 fit() 函数并将数据传递进去来拟合数据集。
Prophet() 对象接受参数来配置您想要的模型类型,例如增长类型、季节性类型等。默认情况下,模型将努力自动确定几乎所有内容。
fit() 函数接受一个时间序列数据的 DataFrame。DataFrame 必须具有特定的格式。第一列必须命名为 ‘ds‘,包含日期时间。第二列必须命名为 ‘y‘,包含观测值。
这意味着我们需要更改数据集中列的名称。它还要求将第一列转换为日期时间对象(如果尚未转换)(例如,这可以在加载数据集时通过 read_csv 的正确参数来完成)。
例如,我们可以修改加载的汽车销售数据集以具有此预期结构,如下所示
|
1 2 3 4 |
... # 准备预期的列名 df.columns = ['ds', 'y'] df['ds']= to_datetime(df['ds']) |
使用汽车销售数据集拟合 Prophet 模型的完整示例列于下方。
|
1 2 3 4 5 6 7 8 9 10 11 12 13 14 |
# 在汽车销售数据集上拟合 prophet 模型 from pandas import read_csv from pandas import to_datetime from fbprophet import Prophet # 加载数据 path = 'https://raw.githubusercontent.com/jbrownlee/Datasets/master/monthly-car-sales.csv' df = read_csv(path, header=0) # 准备预期的列名 df.columns = ['ds', 'y'] df['ds']= to_datetime(df['ds']) # 定义模型 model = Prophet() # 拟合模型 model.fit(df) |
运行示例将加载数据集,将 DataFrame 准备成预期的格式,并拟合 Prophet 模型。
默认情况下,该库在拟合过程中提供了大量的详细输出。我认为这通常是个坏主意,因为它会让开发人员习惯性地忽略输出。
尽管如此,输出总结了模型拟合过程中发生的情况,特别是运行的优化过程。
|
1 2 3 4 5 6 7 8 9 10 11 12 13 14 15 |
INFO:fbprophet:Disabling weekly seasonality. Run prophet with weekly_seasonality=True to override this. INFO:fbprophet:Disabling daily seasonality. Run prophet with daily_seasonality=True to override this. Initial log joint probability = -4.39613 Iter log prob ||dx|| ||grad|| alpha alpha0 # evals Notes 99 270.121 0.00413718 75.7289 1 1 120 Iter log prob ||dx|| ||grad|| alpha alpha0 # evals Notes 179 270.265 0.00019681 84.1622 2.169e-06 0.001 273 LS failed, Hessian reset 199 270.283 1.38947e-05 87.8642 0.3402 1 299 Iter log prob ||dx|| ||grad|| alpha alpha0 # evals Notes 240 270.296 1.6343e-05 89.9117 1.953e-07 0.001 381 LS failed, Hessian reset 299 270.3 4.73573e-08 74.9719 0.3914 1 455 Iter log prob ||dx|| ||grad|| alpha alpha0 # evals Notes 300 270.3 8.25604e-09 74.4478 0.3522 0.3522 456 Optimization terminated normally Convergence detected: absolute parameter change was below tolerance |
在后续章节中,当我们拟合模型时,我不会重复此输出。
接下来,让我们进行预测。
进行样本内预测
对历史数据进行预测可能很有用。
也就是说,我们可以对用作训练模型的数据进行预测。理想情况下,模型已经见过该数据,并且会做出完美的预测。
尽管如此,情况并非如此,因为模型试图泛化所有情况。
这被称为进行样本内(训练集样本内)预测,查看结果可以洞察模型的优劣。也就是说,它在多大程度上学习了训练数据。
通过调用 predict() 函数并传递一个包含名为 ‘ds‘ 的列和包含要预测的所有时间间隔的日期的行 的 DataFrame 来进行预测。
创建这个“forecast” DataFrame 有很多方法。在这种情况下,我们将循环一年日期,例如数据集中的最后 12 个月,并为每个月创建一个字符串。然后,我们将日期列表转换为 DataFrame,并将字符串值转换为日期时间对象。
|
1 2 3 4 5 6 7 8 9 |
... # 定义我们想要预测的时间段 future = list() for i in range(1, 13): date = '1968-%02d' % i future.append([date]) future = DataFrame(future) future.columns = ['ds'] future['ds']= to_datetime(future['ds']) |
然后可以将此 DataFrame 提供给 predict() 函数来计算预测。
predict() 函数的结果是一个包含许多列的 DataFrame。也许最重要的列是预测日期时间 (‘ds‘)、预测值 (‘yhat‘) 以及预测值的上下限 (‘yhat_lower‘ 和 ‘yhat_upper‘),它们提供了预测的不确定性。
例如,我们可以如下打印前几个预测
|
1 2 3 |
... # 汇总预测 print(forecast[['ds', 'yhat', 'yhat_lower', 'yhat_upper']].head()) |
Prophet 还提供了可视化预测与训练数据集的工具。
这可以通过在模型上调用 plot() 函数并将其传递给结果 DataFrame 来实现。它将创建训练数据集的图,并叠加预测以及预测日期的上下限。
|
1 2 3 4 5 |
... print(forecast[['ds', 'yhat', 'yhat_lower', 'yhat_upper']].head()) # 绘制预测 model.plot(forecast) pyplot.show() |
将所有这些联系起来,下面列出了进行样本内预测的完整示例。
|
1 2 3 4 5 6 7 8 9 10 11 12 13 14 15 16 17 18 19 20 21 22 23 24 25 26 27 28 29 30 31 |
# 进行样本内预测 from pandas import read_csv from pandas import to_datetime from pandas import DataFrame from fbprophet import Prophet from matplotlib import pyplot # 加载数据 path = 'https://raw.githubusercontent.com/jbrownlee/Datasets/master/monthly-car-sales.csv' df = read_csv(path, header=0) # 准备预期的列名 df.columns = ['ds', 'y'] df['ds']= to_datetime(df['ds']) # 定义模型 model = Prophet() # 拟合模型 model.fit(df) # 定义我们想要预测的时间段 future = list() for i in range(1, 13): date = '1968-%02d' % i future.append([date]) future = DataFrame(future) future.columns = ['ds'] future['ds']= to_datetime(future['ds']) # 使用模型进行预测 forecast = model.predict(future) # 汇总预测 print(forecast[['ds', 'yhat', 'yhat_lower', 'yhat_upper']].head()) # 绘制预测 model.plot(forecast) pyplot.show() |
运行示例将预测数据集的最后 12 个月。
将报告预测的前五个月,我们可以看到值与数据集中实际销售值没有太大差异。
|
1 2 3 4 5 6 |
ds yhat yhat_lower yhat_upper 0 1968-01-01 14364.866157 12816.266184 15956.555409 1 1968-02-01 14940.687225 13299.473640 16463.811658 2 1968-03-01 20858.282598 19439.403787 22345.747821 3 1968-04-01 22893.610396 21417.399440 24454.642588 4 1968-05-01 24212.079727 22667.146433 25816.191457 |
接下来,将创建一张图。我们可以看到训练数据表示为黑点,预测线为蓝色,上下限为蓝色阴影区域。
我们可以看到预测的 12 个月与实际观测值非常匹配,尤其是在考虑了范围的情况下。
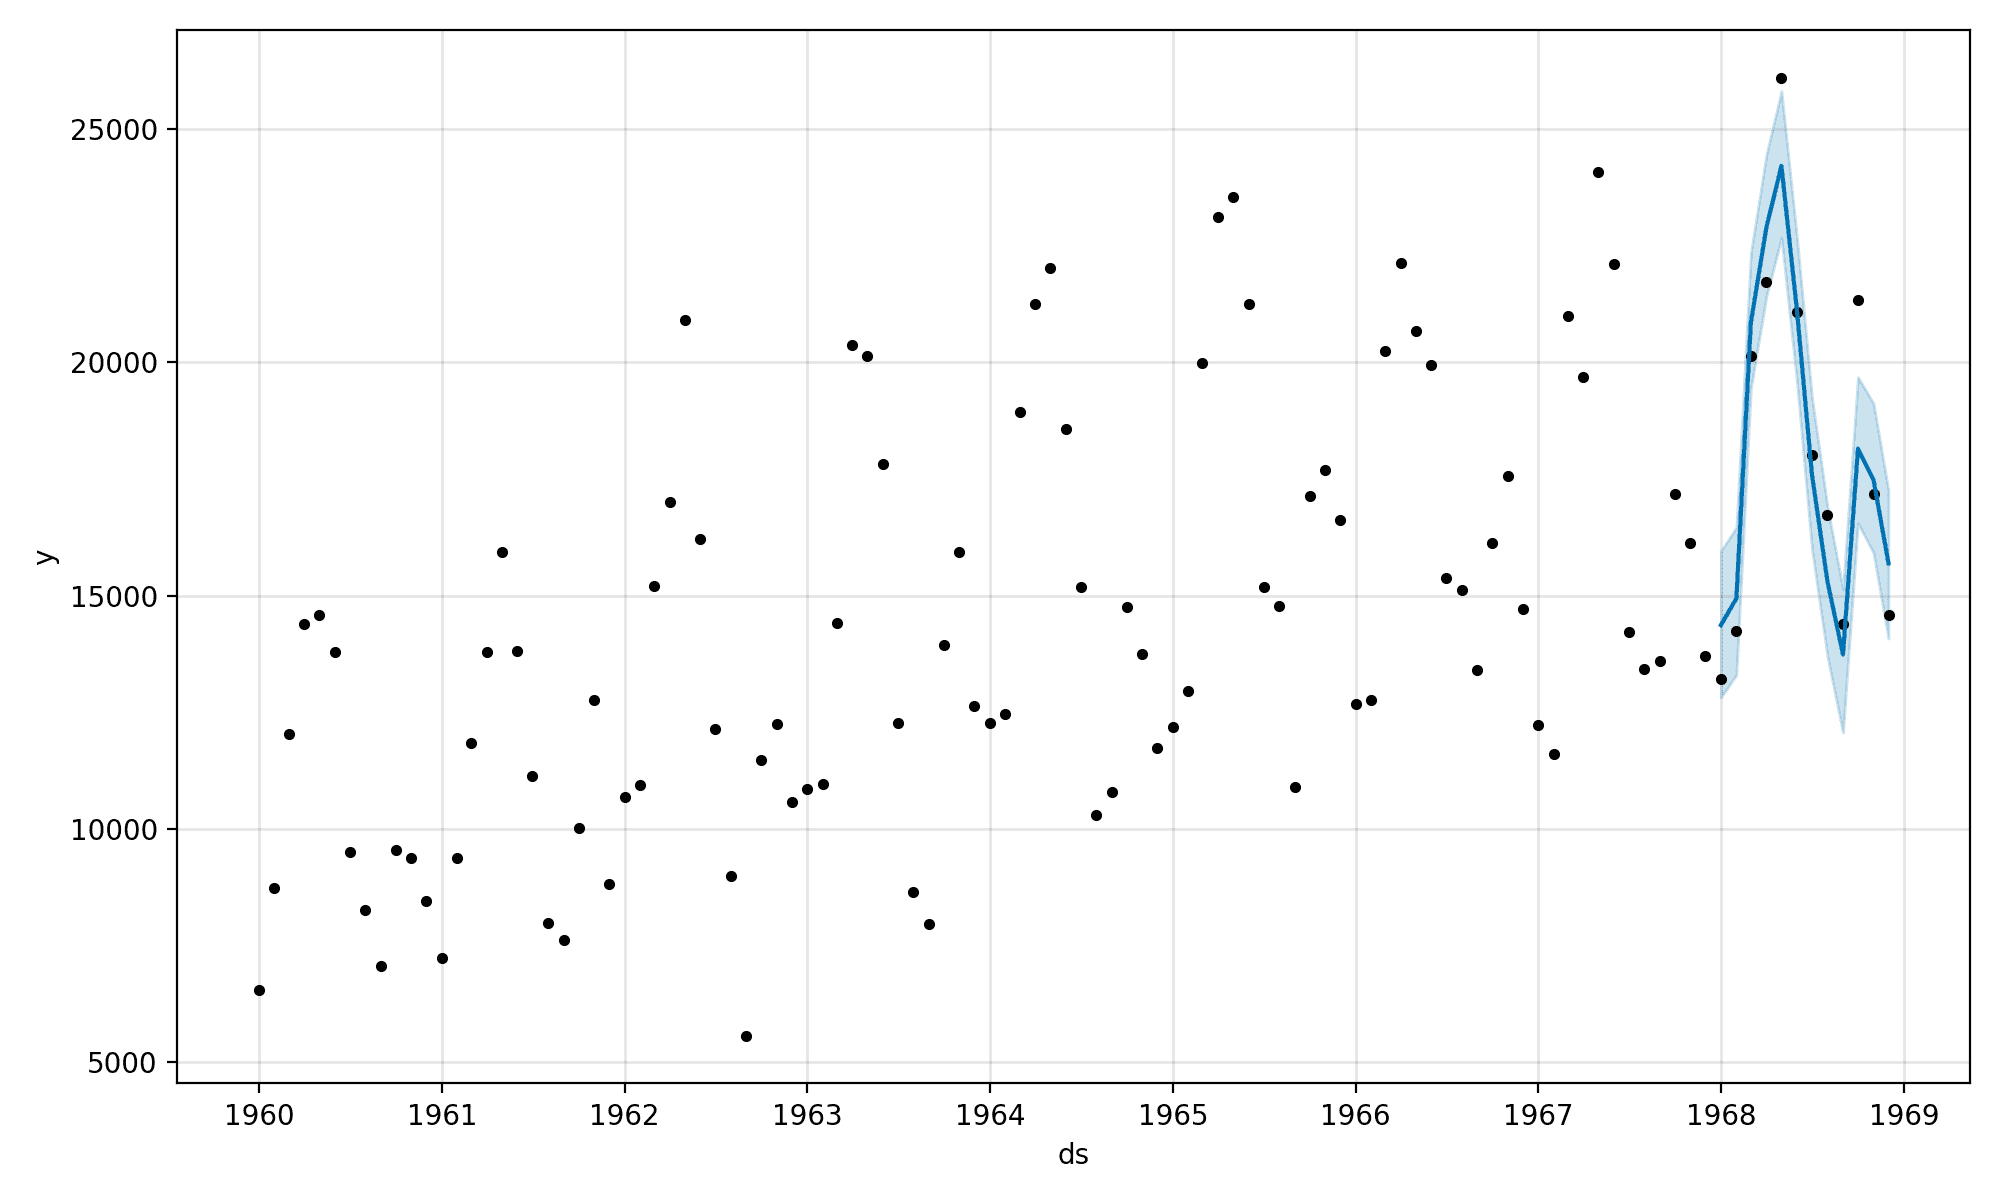
Prophet 时间序列和样本内预测图
进行样本外预测
实际上,我们真正希望预测模型能够做出超出训练数据的预测。
这被称为样本外预测。
我们可以通过与样本内预测相同的方式来实现这一点,只需指定一个不同的预测期。
在这种情况下,一个超出训练数据集末尾的时期,从 1969-01 开始。
|
1 2 3 4 5 6 7 8 9 |
... # 定义我们想要预测的时间段 future = list() for i in range(1, 13): date = '1969-%02d' % i future.append([date]) future = DataFrame(future) future.columns = ['ds'] future['ds']= to_datetime(future['ds']) |
将这些结合起来,完整的示例列在下面。
|
1 2 3 4 5 6 7 8 9 10 11 12 13 14 15 16 17 18 19 20 21 22 23 24 25 26 27 28 29 30 31 |
# 进行样本外预测 from pandas import read_csv from pandas import to_datetime from pandas import DataFrame from fbprophet import Prophet from matplotlib import pyplot # 加载数据 path = 'https://raw.githubusercontent.com/jbrownlee/Datasets/master/monthly-car-sales.csv' df = read_csv(path, header=0) # 准备预期的列名 df.columns = ['ds', 'y'] df['ds']= to_datetime(df['ds']) # 定义模型 model = Prophet() # 拟合模型 model.fit(df) # 定义我们想要预测的时间段 future = list() for i in range(1, 13): date = '1969-%02d' % i future.append([date]) future = DataFrame(future) future.columns = ['ds'] future['ds']= to_datetime(future['ds']) # 使用模型进行预测 forecast = model.predict(future) # 汇总预测 print(forecast[['ds', 'yhat', 'yhat_lower', 'yhat_upper']].head()) # 绘制预测 model.plot(forecast) pyplot.show() |
运行示例将对汽车销售数据进行样本外预测。
将打印预测的前五行,尽管很难判断它们是否合理。
|
1 2 3 4 5 6 |
ds yhat yhat_lower yhat_upper 0 1969-01-01 15406.401318 13751.534121 16789.969780 1 1969-02-01 16165.737458 14486.887740 17634.953132 2 1969-03-01 21384.120631 19738.950363 22926.857539 3 1969-04-01 23512.464086 21939.204670 25105.341478 4 1969-05-01 25026.039276 23544.081762 26718.820580 |
将创建一张图,以帮助我们评估与训练数据相关的预测。
新的年度预测看起来是合理的,至少从肉眼来看。
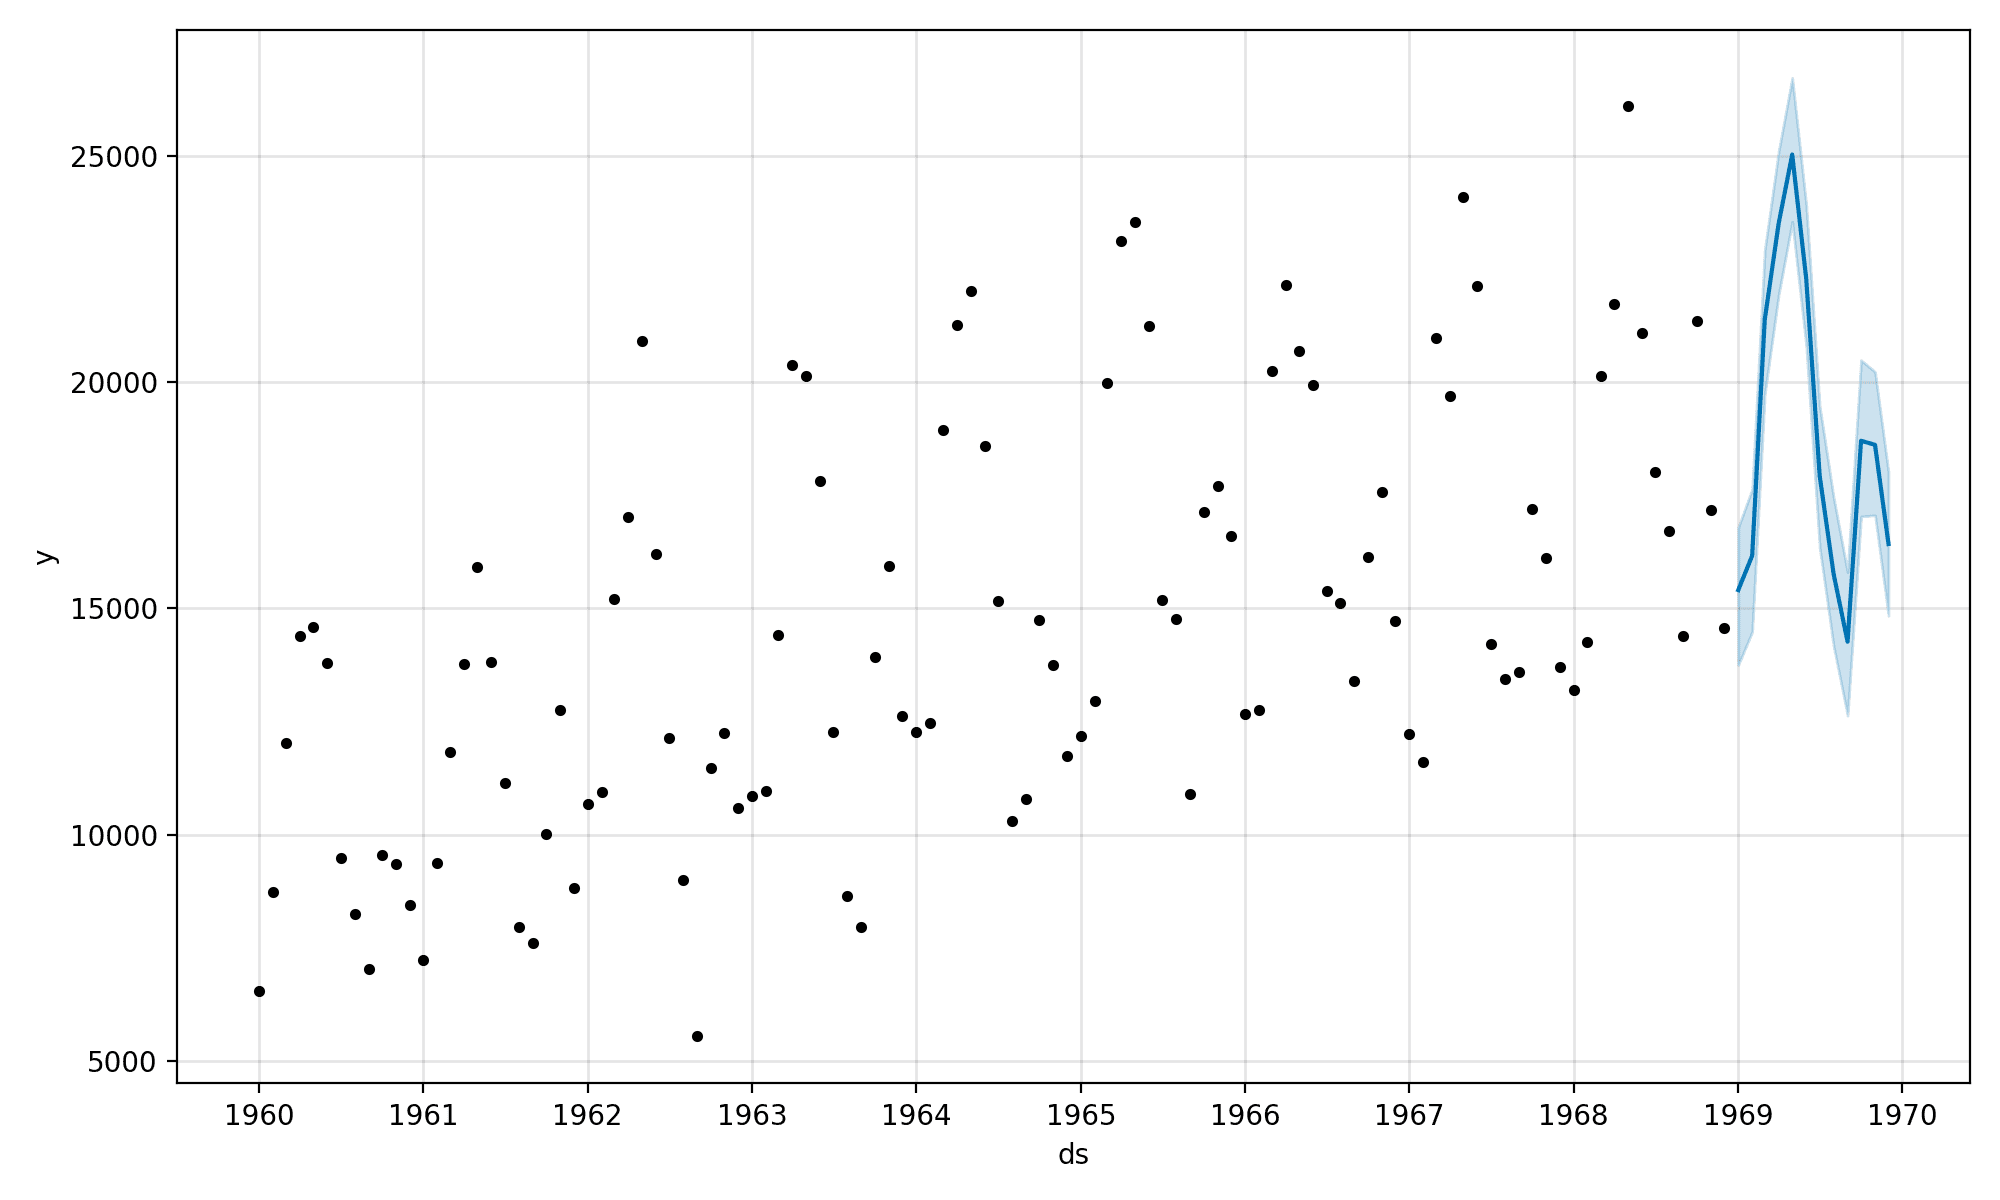
Prophet 时间序列和样本外预测图
手动评估预测模型
开发预测模型性能的客观估计至关重要。
这可以通过将部分数据保留给模型来实现,例如最后 12 个月。然后,在第一部分数据上拟合模型,用它来对保留的数据进行预测,并计算一个误差度量,例如跨预测的平均绝对误差。例如,模拟的样本外预测。
该分数给出了模型在进行样本外预测时平均表现的估计。
我们可以通过创建新的 DataFrame 进行训练,并删除最后 12 个月的数据来做到这一点。
|
1 2 3 4 |
... # 创建测试数据集,删除最后 12 个月 train = df.drop(df.index[-12:]) print(train.tail()) |
然后可以对最后 12 个月的日期时间进行预测。
然后,我们可以从原始数据集中检索预测值和期望值,并使用 scikit-learn 库计算平均绝对误差度量。
|
1 2 3 4 5 6 |
... # 计算十二月实际值和预测值之间的 MAE y_true = df['y'][-12:].values y_pred = forecast['yhat'].values mae = mean_absolute_error(y_true, y_pred) print('MAE: %.3f' % mae) |
将实际值与预测值进行比较绘制出来以查看样本外预测与已知值的匹配程度也很有帮助。
|
1 2 3 4 5 6 |
... # 绘制实际值与预测值 pyplot.plot(y_true, label='Actual') pyplot.plot(y_pred, label='Predicted') pyplot.legend() pyplot.show() |
将所有这些联系起来,下面的示例演示了如何在保持的数据集上评估 Prophet 模型。
|
1 2 3 4 5 6 7 8 9 10 11 12 13 14 15 16 17 18 19 20 21 22 23 24 25 26 27 28 29 30 31 32 33 34 35 36 37 38 39 40 |
# 在保持的数据集上评估 prophet 时间序列预测模型 from pandas import read_csv from pandas import to_datetime from pandas import DataFrame from fbprophet import Prophet from sklearn.metrics import mean_absolute_error from matplotlib import pyplot # 加载数据 path = 'https://raw.githubusercontent.com/jbrownlee/Datasets/master/monthly-car-sales.csv' df = read_csv(path, header=0) # 准备预期的列名 df.columns = ['ds', 'y'] df['ds']= to_datetime(df['ds']) # 创建测试数据集,删除最后 12 个月 train = df.drop(df.index[-12:]) print(train.tail()) # 定义模型 model = Prophet() # 拟合模型 model.fit(train) # 定义我们想要预测的时间段 future = list() for i in range(1, 13): date = '1968-%02d' % i future.append([date]) future = DataFrame(future) future.columns = ['ds'] future['ds'] = to_datetime(future['ds']) # 使用模型进行预测 forecast = model.predict(future) # 计算十二月实际值和预测值之间的 MAE y_true = df['y'][-12:].values y_pred = forecast['yhat'].values mae = mean_absolute_error(y_true, y_pred) print('MAE: %.3f' % mae) # 绘制实际值与预测值 pyplot.plot(y_true, label='Actual') pyplot.plot(y_pred, label='Predicted') pyplot.legend() pyplot.show() |
运行示例将首先报告训练数据集的最后几行。
它确认训练在 1967 年的最后一个月结束,1968 年将被用作保留数据集。
|
1 2 3 4 5 6 |
ds y 91 1967-08-01 13434 92 1967-09-01 13598 93 1967-10-01 17187 94 1967-11-01 16119 95 1967-12-01 13713 |
接下来,将计算预测期间的平均绝对误差。
在这种情况下,我们可以看到误差约为 1,336 辆车,这比同期误差为 3,235 辆车的简单持久模型要低(好)得多。
|
1 |
MAE: 1336.814 |
最后,将创建一张图来比较实际值与预测值。在这种情况下,我们可以看到预测是一个很好的拟合。模型具有技能,并且预测看起来是合理的。
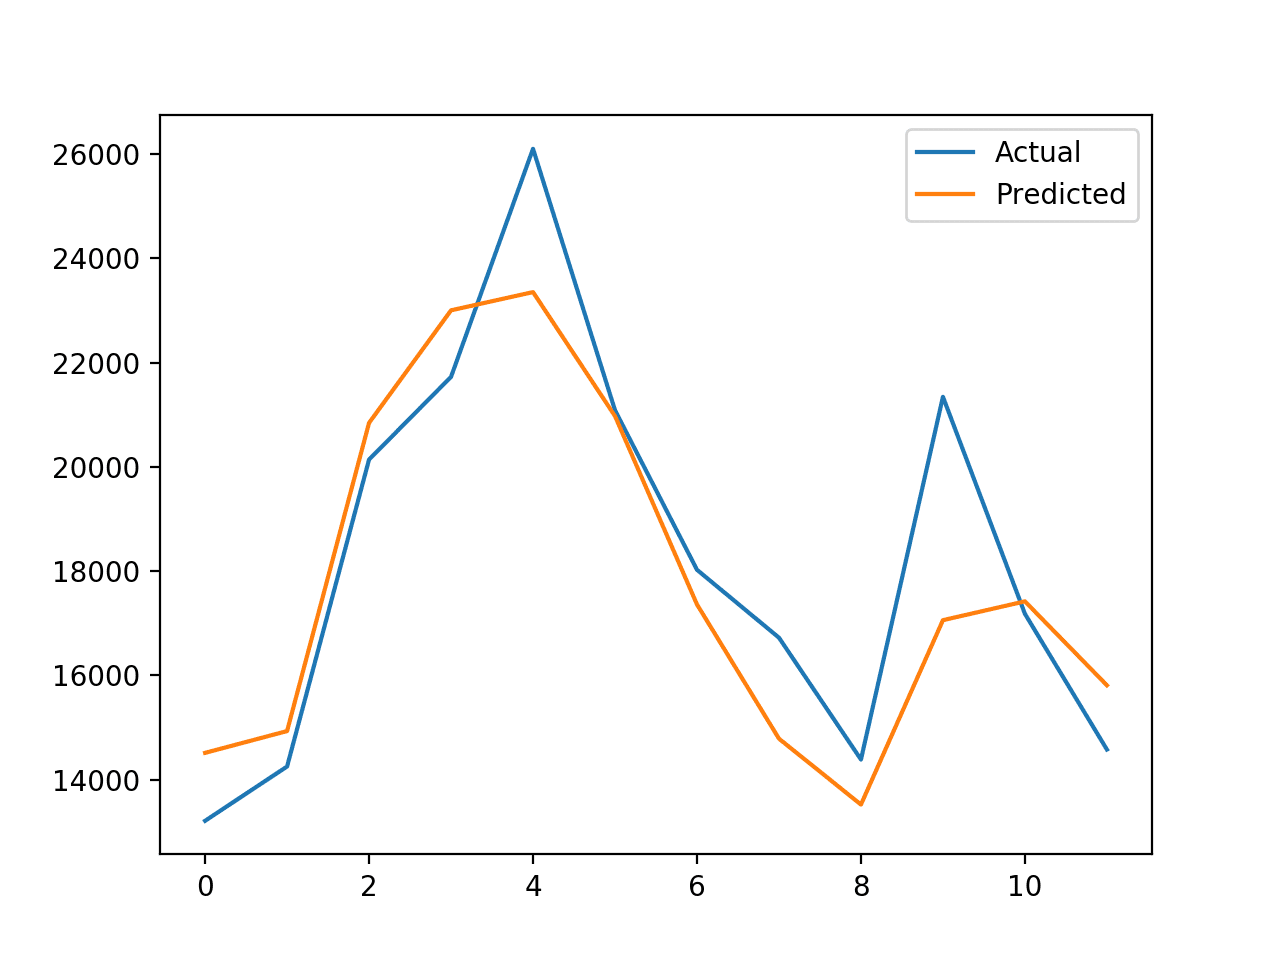
最后 12 个月汽车销售的实际值与预测值图
Prophet 库还提供了自动评估模型和绘制结果的工具,尽管这些工具似乎无法很好地处理分辨率高于一天的数据。
进一步阅读
如果您想深入了解,本节提供了更多关于该主题的资源。
- Prophet 主页.
- Prophet GitHub 项目.
- Prophet API 文档.
- Prophet:大规模预测, 2017.
- 大规模预测, 2017.
- 汽车销售数据集.
- Package ‘prophet’, R 文档.
总结
在本教程中,您了解了如何使用 Facebook Prophet 库进行时间序列预测。
具体来说,你学到了:
- Prophet 是由 Facebook 开发的开源库,专为单变量时间序列数据的自动预测而设计。
- 如何拟合 Prophet 模型并使用它们进行样本内和样本外预测。
- 如何在保持的数据集上评估 Prophet 模型。
你有什么问题吗?
在下面的评论中提出你的问题,我会尽力回答。
想用Python开发时间序列预测吗?
几分钟内开发您自己的预测
...只需几行python代码在我的新电子书中探索如何实现
Python 时间序列预测入门
它涵盖了**自学教程**和**端到端项目**,主题包括:*数据加载、可视化、建模、算法调优*等等。
最终将时间序列预测带入
您自己的项目
跳过学术理论。只看结果。


你好,
1.我有一个为期 10 年的每小时天气数据集(hourly_date , temp , press, wind-direction)
2.我想在未来一年预测所有这些每小时的特征
这是否可能?
哪种方法最好。
谢谢。
也许开发一个原型看看?
请注意,Prophet 只支持单变量数据。
实际上 Prophet 通过 add_regressors 方法支持外部回归变量。
https://fbdocs.cn/prophet/docs/seasonality,_holiday_effects,_and_regressors.html#additional-regressors
非常棒的提示,谢谢!
抱歉,我看到 OP 想要的是多元预测,而不是带有外部回归变量的单变量预测。所以,正确地说,Prophet 不支持多元预测。
也许可以看看 R 包 BSTS。
您使用 fbprophet 的程序无法运行:这是错误
INFO:numexpr.utils:NumExpr defaulting to 8 threads.
INFO:fbprophet:Disabling weekly seasonality. Run prophet with weekly_seasonality=True to override this.
INFO:fbprophet:Disabling daily seasonality. Run prophet with daily_seasonality=True to override this.
—————————————————————————
KeyError 回溯(最近的调用在最后)
KeyError: ‘metric_file’
很抱歉听到您遇到了麻烦,也许这些技巧会有帮助
https://machinelearning.org.cn/faq/single-faq/why-does-the-code-in-the-tutorial-not-work-for-me
当我尝试在 Jupyter 中使用 Prophet 时,也遇到了这个问题。解决方案是使用 Anaconda Power Shell 进行安装。
如果我们想构建一个多元时间序列预测模型,向量自回归 (VAR) 模型将更合适。对于二元时间序列预测,我们可以进行 Granger 因果检验。
可以使用 sckitlearn 管道使用此模型吗?
好问题。
我手头不知道。我猜不会,但可以试试看。
嘿 Abbas,你可以看看HCrystalBall,它among other libraries也把prophet封装到了sklearn的接口里。
https://github.com/heidelbergcement/hcrystalball
谢谢分享,Michal!
这是ARIMA的另一个实现吗?
Prophet 与 ARIMA 何时使用,有什么需要注意的吗?
Statsmodels 提供了一个有用的 ARIMA 和 SARIMA 的实现,例如
https://machinelearning.org.cn/how-to-grid-search-sarima-model-hyperparameters-for-time-series-forecasting-in-python/
在你的数据集上测试一系列算法和算法配置,找出最有效的,然后使用它。没有更可靠的算法选择方法。
FBProphet不是ARIMA的实现,根据他们的论文
其核心是,Prophet方法是一种具有四个主要组成部分的加性回归模型
分段线性或逻辑增长曲线趋势。Prophet通过从数据中选择变化点来自动检测趋势变化。
一年一度的季节性成分,使用傅里叶级数建模。
一个使用虚拟变量的每周季节性成分。
用户提供的重要的节假日列表。
..
我们更喜欢使用一个非常灵活的回归模型(有点像曲线拟合),而不是传统的时间序列模型。
据我所知,在时间序列预测中,一个序列需要是平稳的。序列应该具有恒定的均值、方差和协方差。而且我也没有看到归一化和标准化重标度应用于数据集。
是我遗漏了什么吗??
这会有帮助,甚至被推荐,但不是必需的。
此外,有些实现会为你完成这些步骤。
Hola, tengo una data diaria de ingresos con con síntomas respiratorios unos días ingresan más otros menos es fluctuante para el cálculo puedo utilizar el prophet para la data de entrenamiento sería colocar el 75% del total de los días q tengo el dato q sería 120 dias o q me puedes recomendar para pronosticar los ingresos en los próximos 15 dias porque el dato tengo desde marzo 2020
我建议在你的数据集上测试一套不同的数据转换、算法和算法配置,找出哪些效果好或最好。
Apparently there are known issues installing pystan and fbprophet on a windows machine.
听到这个消息我很难过。
也许可以尝试在本地使用Linux虚拟机?
https://machinelearning.org.cn/linux-virtual-machine-machine-learning-development-python-3/
也许可以尝试AWS EC2实例?
https://machinelearning.org.cn/develop-evaluate-large-deep-learning-models-keras-amazon-web-services/
不错的帖子,Jason!
我想知道你是否发布过关于多变量预测的东西。也许是向量自回归 (VAR)? https://statsmodels.cn/dev/vector_ar.html
此致
是的,这是一个不错的开始。
https://machinelearning.org.cn/time-series-forecasting-methods-in-python-cheat-sheet/
嘿 Robert,你用conda试过吗?在我们的CI管道中,我在Windows上安装conda install -c conda-forge fbprophet=0.6没有任何问题,在我测试该库时也没有问题,它在我的私人笔记本上使用prophet…
你最好使用google colab,
我努力让anaconda spyder工作,但没有成功
当我转移到colab时,它对我来说运行得很好
我建议使用sublime这样的文本编辑器,而不是笔记本或IDE。
https://machinelearning.org.cn/faq/single-faq/why-dont-use-or-recommend-notebooks
尊敬的Jason博士,
我想分享我安装fbprophet的经验。
其中一个先决条件是安装pystan。
出于我无法解释的原因,安装最新的pystan v2.19.1.1会成功安装,但它无法在IDE Python或命令行Python中实例化。
即使你通过piping安装:pip install pystan,你也会在IDE Python版本或命令行版本中遇到DLL错误。
如果你尝试pip fbprophet,你会在安装过程中遇到很多错误。
一个变通的方法是使用较低版本的pystan。
当我实例化Python的IDLE中的fbprophet时
观察结果
* version 2.17 of pystan worked. The file is 36MB compared to version 2.19.1.1 which is 79MB.
* the lower version of pystan did not have any adverse effect on the running of fbprophet especially where fbprophet.__version__ = 0.6 compared to the version 0.5 used in the tutorial.
结论
If you are having trouble installing fbprophet because it installed version 2.19.1.1 of pystan, then use a lower version of pystan such as version 2.17.
As a result I did not have any trouble completing the exercises in this tutorial.
At issue is whether you are using pystan for other packages. I cannot comment on the other applications using pystan.
谢谢你,
悉尼的Anthony
好建议,Anthony,谢谢分享!
另一个选择可能是从conda安装。例如,conda-forge with fbprophet=0.6 在我们所有的操作系统上都有效。
conda install -c conda-forge fbprophet=0.6
好建议。
嗨,Jason,
Just wanted to say I very much agree with this line: “By default, the library provides a lot of verbose output during the fit process. I think it’s a bad idea in general as it trains developers to ignore output.” Thanks for writing.
谢谢你,Sam!!!
很多开源项目都这样做。甚至tensorflow,keras,和scikit-learn。这就像开发者从未编写过面向用户的软件一样。
这对于开发者(他们会忽视真正的问题)和用户(他们永远不想看到这些东西)来说都是一个糟糕的做法。记录下来也是浪费时间,除非发生重大问题,否则没有人会查看日志,而那时已经太晚了。
我每周都会收到新开发者的邮件,询问他们在tensorflow输出大量警告时做错了什么。我不得不告诉他们这不是他们的错。
咆哮完毕 :)
嗨,Jason,
我得到了一些负值的yhat(预测)。有什么方法可以摆脱预测中的负值吗?因为在我的用例中,负的预测值没有意义。
也许可以使用numpy的absolute()函数。
嗨,Jason,
感谢您的建议,但我的担忧是,即使在fbprophet的逻辑增长曲线模型中将上限设置为0,我仍然在预测中得到负值。
我进行了一些调试,发现逻辑增长曲线模型中的上限值只会影响时间序列的“趋势”分量。因此,如果我们最终预测中出现负值,我们需要人为地将其上限设置为0。
不错的发现。
Hi Jason, if I get you right; Facebook Prophet does not necessarily require that a time series be made stationary as it handles that for us. Am I right?
我相信它会像ETS和SARIMA一样,将趋势和季节性作为模型的一部分来捕捉。
嗨,Jason,
I am having a problem with the ‘in sample’ plots. Although both my actual and predicted data set contains the data required to plot the in-sample, the actuals are not being plotted, but the ‘predictions’ are, making the plot look like an ‘out-sample’ plot.
Do you have experience with this problem? Thanks
你可以使用matplotlib的折线图来绘制任何你想要的东西,也许从这里开始
https://machinelearning.org.cn/time-series-data-visualization-with-python/
pip does not need sudo
only if you want to make an installation for all users
other than for that you’re giving away superuser permissions for no reason.
thanks for the good tutorial anyway :)
谢谢。
I have a question, what does it mean if the yhat_lower and yhat_upper have the same value? my settings are
model = Prophet(
mcmc_samples=0,
interval_width=0.20,
uncertainty_samples=True,
yearly_seasonality=False,
weekly_seasonality=False,
daily_seasonality=False)
I have been playing around with the intervals but the bounds of lower and upper are still the same.
It means that the model is very certain about the prediction, or is broken :)
你好,Jason Brownlee,
Thank you for such a helpful platform. I learn a lot from your post and trying to explore more.
Recently, I had a problem and posting this comment in the hope of a quick response.
Actually, I have data for a year (single data per minute>> 525602 samples). I am trying to check the accuracy level for the different test set (e.g. hour, week, month) with Make an In-Sample Forecast model. However, I had an issue to run the code related to the string. I think I made a mistake to define the period. Actually, I wrote as follow for the 1 month of test set
for i in range(1, 30*24*60)
date = ‘2019-12-01-00 %02d’ % i
future.append([date])
Here, 30*24*60 is the total samples for 1 month. I tried a lot by changing the position, but always failed with different errors (some time related to the string, some time format, and some time over data size)
Could you please suggest me, how can I correct it?
Sorry to hear that. I don’t have good off the cuff advice, perhaps try posting your question to stackoverflow.com
嗨,Jason,
Great tutorial!. Thanks.
I share my
1º) Experiments
– installing fbprophet library I got an error with “plotly” on my Mac. I fix it installing
“% sudo pip install –upgrade plotly”.
– I apply Sklearn MinMaxScaler to scale the ‘y’ df column serie. But I got exactly the same ‘MAE’ results. So my conclusion is that Prophet model apply internally this/or equivalent standardisation.
– I compare these prophet evaluation ( I use ‘rmse’ instead as common metric) vs other classical ‘statsmodels’ such as AutoReg, AR, ARMA, ARIMA, SARIMA, SimpleExpSmothing and ExponentialSmothing …and the best results is with classical SARIMA model . SARIMA model is even better than LSTM DL model. I found Prophet model something in between all models (e.g.mean)
2º) Comments
– One to the key issue (some time hard to explain) of time series (in my opinion) vs other ML techniques is, preparing data and its confusing associate terminology (inputs/features with multiple time steps/lags on univariate/multivariate vs outputs (multiple time steps forecast). I see the ‘ds’ time format column on prophet model application, but also I read other tutorials from you with its equivalent data preparation function of ‘TimeseriesGenerator’ from keras and also I like very much your function ‘series_to_supervised’ that split or shift multivariate on an uni/multivariate multistep (lags on inputs) and multiple-steps forecast (i found very powerful input-output splitting function).
3º) Questions
– may we save/load prophet model as an options, as it is the case on keras model with .h5 file?
– may we plot prophet (image) model as an option, as it is is the case on Keras with plot_model() function?
– may we choose how many time steps (or lags) to use as argument of time series prophet model? Or it is nor an user option?
此致,
Well done on your experiments!
I would expect you can save/load a model, I have not tried it with this lib though – so experiments may be required.
I don’t think you can plot the internals of the model like keras.
Not sure about lags, I think it is optimized as part of the fit. You may need to check the API docs.
thank you Jason!
you provide great value and a lot of trust on ML practices!
谢谢!
嗨,Jason,
One more question.
Due to bad expectation on Deep Learning performance on Time series (normally under classical and simpler statistics results) …some recent techniques apply to transform from time domain to another one (e.g. via ‘cosine transformation’).
Do you have more info on it?
Are they referring to DCT (Discrete Cosine Transformation) that convert time domain representation to frequency domain representation … I am confused about these possibilities. I appreciate to hear your opinion (and/or references) on this matter.
目前还没有,也许将来会有。
嗨,Jason,
Are you going to update your Time Series Book with projects using Prophet in the near future?
此致
Jeharul
No plans at this stage.
Hey Thanks a lot for such a wonderful explanation but I am getting negative forecast for FBProphet when regressor are added in the model. Please help me with this.
Perhaps you can use an alternate model configuration?
Perhaps you can use an alternate model?
Perhaps you can pre-process your data, e.g. scaling?
Nice blog post! I’ve learnt so much from this and am trying to follow through the steps on a different data. I can’t understand why but I come across with parser error for the code below
future[‘ds’]= to_datetime(future[‘ds’])
It said Unknown string format: 2019-0000001. Is this something wrong with my date format?
Thanks so much for this, Jason!
谢谢。
Perhaps you will need to adapt the code for your data, e.g. parse the date-time column in a different way.
Thank you for these great tutorial, it works well for me.
Could someone show me how to save the forecast in a CSV file? That would really help me. Many Thanks!
不客气。
是的,请看这个
https://machinelearning.org.cn/how-to-save-a-numpy-array-to-file-for-machine-learning/
嗨,Jason,
Your tutorials are always fabulous and the example above is worked. But I don’t understand what exactly the differences between LSTM and I wanna know if features can do something in prophet? For instance, if we also have data about the driving license and so on, will it be useful?
I recommend evaluating a suite of different models and discover what works well or best for your specific dataset.
嗨,Jason,
Just did a quick check on previous comments, not sure if this is mentioned
I’m running an Anaconda environment.
From the Anaconda base environment cli,
pystan installs fine and it lists in the package list no problem (current version 2.19.1.1)
pip install prophet doesn’t work, get a ton of errors.
However, the following does work
conda install -c conda-forge prophet
When I import prophet, got the following alert
“Importing plotly failed. Interactive plots will not work”
So did pip install plotly in the base environment and now everything works fine!
Current prophet version is 1.0
It’s no longer fbprophet, just prophet
此致
是的,名称在 1.0 版本时发生了更改
你好!
在向前走或滚动预测方法中使用 Prophet 正常吗?您是否只是相应地拟合和预测?
此致
你好,Jason。
我曾在使用 R 中的 forecast 和 auto.arima 函数时,为 18k 多个唯一 ID(每个 ID 由 28 个观测值组成)运行了 18k+ 次 auto arima 迭代(超过 50 万行)。15 分钟即可完成。但当我使用 Python(我尝试过 pmdarima 和 fbprophet 库)时,却需要几个小时。花费的时间太长,以至于我每次尝试时都不得不中止执行。代码是没问题的,并且在少量样本上可以运行,但在整个数据集上运行时却会失败。
正如我所说,使用 R 只需 15 分钟。您知道这是怎么回事吗?我只想在 Python 中按 18k 个不同的组(每个组包含 28 个观测值)运行 auto arima。您有什么建议吗?
谢谢
Al
嗨,Jason!
我正在使用月度数据来估算模型,并将对下个月进行预测,并与实际值进行比较,以了解实际值是否在正常范围内。每个月我都会重复这个过程:对下个月进行预测,并与实际值进行比较。
我想知道您是否建议我每个月重新估算模型,将上个月的值纳入模型,还是应该只使用最初估算出的模型来预测下个月?
非常感谢,
Karla
你好 Karla… 虽然我不能直接评论您的项目,但您提出的方法是非常合理的。
你好,James。我想赞赏你对所有人的回复,无论时间长短。给你点赞!
嗨,Jason,
我正在尝试使用单变量数据预测多个供应商的销售额,一些供应商的预测效果很好(有些供应商有趋势,有些供应商没有趋势或季节性),而大多数供应商的预测效果非常差。我注意到大多数供应商的销售额没有趋势或季节性,但模型能够更好地预测 15% 到 20% 的供应商,其余 80% 的预测都失败了。
我的问题是,数据集必须具有趋势或季节性才能进行时间序列预测(因为有些供应商没有趋势或季节性,但它们通过 Prophet 预测表现更好)。另外,请告诉我数据集用于时间序列预测的其他限定条件。
你好 Kumar… 以下资源可能对您感兴趣
https://www.analyticsvidhya.com/blog/2021/07/time-series-forecasting-complete-tutorial-part-1/
https://machinelearning.org.cn/how-to-develop-lstm-models-for-time-series-forecasting/
你好!有没有办法将预测存储到数据框中,然后存储到 Excel 中?
你好 Tuhina… 以下资源可能对您感兴趣
https://www.dataquest.io/blog/tutorial-time-series-analysis-with-pandas/
Prophet 模型是否有超参数调整的方法?例如网格搜索或其他方法?
你好 Md… 以下讨论可能对您感兴趣
https://stackoverflow.com/questions/69856048/hyperparameter-tuning-fb-prophet-model-how-to-reference-m-add-seasonality-cate
!pip install prophet #instead of fpprophet for the example to work on Google Colab
from prophet import Prophet
感谢 Mahyar 的建议!
有时,Prophet 的样本内预测与实际值相同(像是一个伪影)。有人知道为什么吗?
你好 Chen… 在那些情况下,似乎出现了过度拟合。以下资源可能对您感兴趣
https://machinelearning.org.cn/early-stopping-to-avoid-overtraining-neural-network-models/
请问如何从已拟合的模型中生成 Prophet 模型方程?
你好 Annan… 要从已拟合的模型中生成 Prophet 模型方程,您需要提取模型的各个组成部分:趋势、季节性、节假日以及任何额外的回归变量(如果使用)。以下是具体操作方法:
### 生成 Prophet 模型方程的步骤
1. **拟合 Prophet 模型:**
确保您已将 Prophet 模型拟合到您的数据中。
pythonfrom fbprophet import Prophet
import pandas as pd
# 加载数据到 DataFrame
df = pd.read_csv('your_time_series_data.csv')
 # 初始化并拟合模型
 model = Prophet()
 model.fit(df)
2. **提取组成部分:**
拟合模型后,提取趋势、季节性、节假日和回归变量等组成部分。
python# 创建未来数据框
future = model.make_future_dataframe(periods=365)
 # 预测未来值
 forecast = model.predict(future)
3. **组成部分计算:**
Prophet 将时间序列分解为以下组成部分:
– **趋势 (T):** 捕捉数据中的总体趋势。
– **季节性 (S):** 捕捉重复模式,如每日、每周或每年的季节性。
– **节假日 (H):** 捕捉节假日的影响。
– **附加回归变量 (R):** 捕捉额外回归变量的影响(如果存在)。
4. **获取组成部分的方程:**
您可以手动组合这些组成部分来形成完整的模型方程。
python# 提取趋势组成部分
trend = forecast['trend']
# 提取年度季节性组成部分(如果存在)
yearly = forecast['yearly']
# 提取周度季节性组成部分(如果存在)
weekly = forecast['weekly']
# 提取日度季节性组成部分(如果存在)
daily = forecast['daily']
# 提取节假日组成部分(如果存在)
holidays = forecast['holidays']
 # 计算最终预测值
 final_forecast = trend + yearly + weekly + daily + holidays
5. **将组成部分组合成方程:**
模型方程可以表示为:
\[
\hat{y}(t) = T(t) + S(t) + H(t) + R(t) + \epsilon_t
\]
其中
– \( T(t) \) 是趋势组成部分。
– \( S(t) \) 是季节性组成部分。
– \( H(t) \) 是节假日组成部分。
– \( R(t) \) 是附加回归变量组成部分。
– \( \epsilon_t \) 是误差项。
### 提取组成部分的示例代码
以下是使用
fbprophet库的完整 Python 示例:pythonimport pandas as pd
from fbprophet import Prophet
# 加载数据
df = pd.read_csv('your_time_series_data.csv')
# 拟合模型
model = Prophet()
model.fit(df)
# 创建未来数据框
future = model.make_future_dataframe(periods=365)
forecast = model.predict(future)
# 提取组成部分
trend = forecast['trend']
yearly = forecast['yearly']
weekly = forecast['weekly']
daily = forecast['daily']
holidays = forecast['holidays']
# 将组成部分组合成最终预测
final_forecast = trend + yearly + weekly + daily + holidays
# 将最终预测添加到数据框
forecast['final_forecast'] = final_forecast
# 显示包含组成部分的预测结果
 print(forecast[['ds', 'trend', 'yearly', 'weekly', 'daily', 'holidays', 'final_forecast']])
这将为您提供一个包含每个组成部分和最终预测值的数据框。您可以根据此信息了解模型各部分对最终预测的贡献。
注意:
yearly、weekly、daily和holidays等组成部分的存在取决于您在初始化模型时是否包含它们。如果未包含任何这些组成部分,它们将不会出现在预测数据框中。