当我们完成一个 Python 项目并将其发布供他人使用时,最简单的方法就是将项目呈现为命令行程序。如果您想使其更友好,您可能希望为程序开发一个图形用户界面 (GUI),这样人们就可以在程序运行时通过鼠标点击与其进行交互。开发 GUI 可能很困难,因为人机交互模型非常复杂。因此,折衷的方法是为您的程序创建一个 Web 界面。与纯粹的命令行程序相比,这需要一些额外的工作,但不如使用 Qt5 库编写界面那么复杂。在本文中,我们将向您展示 Web 界面的详细信息以及为您的程序提供 Web 界面的便捷性。
完成本教程后,你将学到:
- Flask 框架的简单示例
- 使用 Dash 完全用 Python 构建交互式网页
- Web 应用程序如何运行
通过我的新书 《Python for Machine Learning》启动您的项目,该书包含分步教程以及所有示例的Python 源代码文件。
让我们开始吧!
适用于您 Python 项目的 Web 框架
照片来源:Quang Nguyen Vinh。部分权利保留。
概述
本教程分为五个部分;它们是:
- Python 与 Web
- Flask 用于 Web API 应用
- Dash 用于交互式组件
- Dash 中的轮询
- Flask 与 Dash 的结合
Python 与 Web
Web 通过超文本传输协议 (HTTP) 进行传输。Python 的标准库支持与 HTTP 进行交互。如果您只想用 Python 运行 Web 服务器,最简单的方法就是进入要提供服务的目录并运行命令。
|
1 |
python -m http.server |
这通常会在端口 8000 上启动一个 Web 服务器。如果目录中存在 index.html,那么当我们在同一台计算机上使用地址 https://:8000/ 打开浏览器时,它将是默认的服务页面。
内置 Web 服务器非常适合我们只需要快速设置 Web 服务器(例如,让本地网络上的另一台计算机下载文件)的情况。但如果我们要做的更多,例如具有动态内容,那么它就不够了。
在我们继续详细介绍之前,让我们回顾一下当我们谈论 Web 界面时我们想要实现的目标。首先,现代 Web 页面将是与用户交互式地传播信息的界面。这意味着不仅要从服务器发送信息,还要接收来自用户输入。浏览器能够美观地渲染信息。
或者,我们也可以在没有浏览器的情况下使用网页。一种情况是使用 Web 协议下载文件。在 Linux 中,我们有著名的 wget 工具可以完成此任务。另一种情况是查询信息或将信息传递给服务器。例如,在 AWS EC2 实例中,您可以在地址 http://169.254.169.254/latest/meta-data/(其中 169.254.169.254 是 EC2 机器上可用的特殊 IP 地址)查看机器实例的元数据。在 Linux 实例中,我们可以使用 curl 工具进行查看。其输出不是 HTML,而是纯文本机器可读格式。有时,我们称之为 Web API,因为我们将其用作远程执行函数。
这些是 Web 应用程序中的两种不同范例。第一种需要编写代码来处理用户与服务器之间的交互。第二种需要设置各种 URL 端点,以便用户可以使用不同的地址请求不同的内容。在 Python 中,有第三方库可以同时完成这两项工作。
想开始学习机器学习 Python 吗?
立即参加我为期7天的免费电子邮件速成课程(附示例代码)。
点击注册,同时获得该课程的免费PDF电子书版本。
Flask 用于 Web API 应用
允许我们在 Python 中编写程序来构建 Web 应用程序的工具称为Web 框架。有很多。Django 可能是最著名的。然而,不同 Web 框架的学习曲线可能差异很大。一些 Web 框架假定您使用模型-视图设计,并且您需要理解其原理才能理解如何使用它。
作为一名机器学习从业者,您可能希望做一些快速、不太复杂但又足够强大的事情来满足许多用例。Flask 可能是此类中的一个不错的选择。
Flask 是一个轻量级的 Web 框架。您可以将其作为命令运行,也可以将其作为 Python 模块使用。假设我们想编写一个 Web 服务器来报告任何用户指定时区的当前时间。使用 Flask 可以非常轻松地完成。
|
1 2 3 4 5 6 7 8 9 10 11 12 13 14 15 16 |
from datetime import datetime import pytz from flask import Flask app = Flask("time now") @app.route("/now/<path:timezone>") def timenow(timezone): try: zone = pytz.timezone(timezone) now = datetime.now(zone) return now.strftime("%Y-%m-%d %H:%M:%S %z %Z\n") except pytz.exceptions.UnknownTimeZoneError: return f"Unknown time zone: {timezone}\n" app.run() |
将以上内容保存到 server.py 或任何你喜欢的文件名,然后在终端运行。您将看到以下输出:
|
1 2 3 4 5 6 |
* Serving Flask app 'time now' (lazy loading) * Environment: production WARNING: This is a development server. Do not use it in a production deployment. Use a production WSGI server instead. * Debug mode: off * Running on http://127.0.0.1:5000 (Press CTRL+C to quit) |
这意味着您的脚本现在正在 http://127.0.0.1:5000 上作为 Web 服务器运行。它将永远运行 Web 请求,直到您按 Ctrl-C 中断它。
如果您打开另一个终端并查询该 URL,例如在 Linux 中使用 curl
|
1 2 |
$ curl http://127.0.0.1:5000/now/Asia/Tokyo 2022-04-20 13:29:42 +0900 JST |
您将看到您请求的时区(在此例中为 Asia/Tokyo)的时间(您可以在维基百科上查看所有受支持时区的列表)。您代码中函数返回的字符串将是 URL 响应的内容。如果时区不被识别,您将看到如代码中 except 块返回的“Unknown time zone”消息。
如果我们想稍微扩展一下,使其在未提供时区时假定为 UTC,我们只需为函数添加另一个装饰器即可。
|
1 2 3 4 5 6 7 8 9 10 11 12 13 14 15 16 17 18 19 20 |
from datetime import datetime import pytz from flask import Flask app = Flask("time now") @app.route('/now', defaults={'timezone': ''}) @app.route("/now/<path:timezone>") def timenow(timezone): try: if not timezone: zone = pytz.utc 否则: zone = pytz.timezone(timezone) now = datetime.now(zone) return now.strftime("%Y-%m-%d %H:%M:%S %z %Z\n") except pytz.exceptions.UnknownTimeZoneError: return f"Unknown timezone: {timezone}\n" app.run() |
重启服务器,我们可以看到如下结果:
|
1 2 3 4 5 6 |
$ curl http://127.0.0.1:5000/now/Asia/Tokyo 2022-04-20 13:37:27 +0900 JST $ curl http://127.0.0.1:5000/now/Asia/Tok Unknown timezone: Asia/Tok $ curl http://127.0.0.1:5000/now 2022-04-20 04:37:29 +0000 UTC |
如今,许多此类应用程序都返回 JSON 字符串以获得更复杂的数据,但从技术上讲,任何内容都可以传递。如果您希望创建更多 Web API,只需定义您的函数以返回数据,并使用 @app.route() 进行装饰,如上面的示例所示。
Dash 用于交互式组件
Flask 提供的 Web 端点非常强大。许多 Web 应用程序都是通过这种方式实现的。例如,我们可以使用 HTML 编写 Web 用户界面,并使用 Javascript 处理用户交互。一旦用户触发了一个事件,我们就可以让 Javascript 处理任何 UI 更改,并通过将数据发送到某个端点并等待响应来创建一个 AJAX 调用到服务器。AJAX 调用是异步的;因此,当收到 Web 服务器的响应时(通常在几分之一秒内),Javascript 会再次触发以进一步更新 UI,让用户了解情况。
然而,随着 Web 界面的复杂性越来越高,编写 Javascript 代码可能会变得乏味。因此,有许多客户端库可以简化这一点。有些是为了简化 Javascript 编程,例如 jQuery。有些是为了改变 HTML 和 Javascript 的交互方式,例如 ReactJS。但由于我们在 Python 中开发机器学习项目,因此能够在不依赖 Javascript 的情况下用 Python 开发交互式 Web 应用程序将是很好的。Dash 就是为此而设计的。
让我们考虑一个机器学习的例子:我们想使用 MNIST 手写数字数据集来训练一个手写数字识别器。LeNet5 模型在此任务中很有名。但我们想让用户微调 LeNet5 模型,重新训练它,然后使用它进行识别。训练一个简单的 LeNet5 模型只需几行代码即可完成。
|
1 2 3 4 5 6 7 8 9 10 11 12 13 14 15 16 17 18 19 20 21 22 23 24 25 26 27 28 29 30 31 32 33 34 |
import numpy as np import tensorflow as tf from tensorflow.keras.datasets import mnist from tensorflow.keras.models import Sequential from tensorflow.keras.layers import Conv2D, Dense, AveragePooling2D, Flatten from tensorflow.keras.utils import to_categorical # 加载 MNIST 数字 (X_train, y_train), (X_test, y_test) = mnist.load_data() # Reshape data to (n_samples, height, width, n_channel) X_train = np.expand_dims(X_train, axis=3).astype("float32") X_test = np.expand_dims(X_test, axis=3).astype("float32") # 对输出进行独热编码 y_train = to_categorical(y_train) y_test = to_categorical(y_test) # LeNet5 模型 model = Sequential([ Conv2D(6, (5,5), activation="tanh", input_shape=(28,28,1), padding="same"), AveragePooling2D((2,2), strides=2), Conv2D(16, (5,5), activation="tanh"), AveragePooling2D((2,2), strides=2), Conv2D(120, (5,5), activation="tanh"), Flatten(), Dense(84, activation="tanh"), Dense(10, activation="softmax") ]) # 训练模型 model.compile(loss="categorical_crossentropy", optimizer="adam", metrics=["accuracy"]) model.fit(X_train, y_train, validation_data=(X_test, y_test), epochs=100, batch_size=32) |
这里有几个我们可以更改的代码中的超参数,例如激活函数、训练优化器、训练轮数和批次大小。我们可以创建一个 Dash 界面让用户更改这些参数并重新训练模型。这个界面将用 HTML 显示,但用 Python 编写。
|
1 2 3 4 5 6 7 8 9 10 11 12 13 14 15 16 17 18 19 20 21 22 23 24 25 26 27 28 29 30 31 32 33 34 35 36 37 38 39 40 41 42 43 44 45 46 47 48 49 50 51 52 53 54 55 56 57 58 59 60 61 62 63 64 65 66 67 68 |
... from flask import Flask from dash import Dash, html, dcc # 默认值 model_data = { "activation": "relu", "optimizer": "adam", "epochs": 100, "batchsize": 32, } ... server = Flask("mlm") app = Dash(server=server) app.layout = html.Div( id="parent", children=[ html.H1( children="LeNet5 training", style={"textAlign": "center"} ), html.Div( className="flex-container", children=[ html.Div(children=[ html.Div(id="activationdisplay", children="Activation:"), dcc.Dropdown( id="activation", options=[ {"label": "Rectified linear unit", "value": "relu"}, {"label": "Hyperbolic tangent", "value": "tanh"}, {"label": "Sigmoidal", "value": "sigmoid"}, ], value=model_data["activation"] ) ]), html.Div(children=[ html.Div(id="optimizerdisplay", children="Optimizer:"), dcc.Dropdown( id="optimizer", options=[ {"label": "Adam", "value": "adam"}, {"label": "Adagrad", "value": "adagrad"}, {"label": "Nadam", "value": "nadam"}, {"label": "Adadelta", "value": "adadelta"}, {"label": "Adamax", "value": "adamax"}, {"label": "RMSprop", "value": "rmsprop"}, {"label": "SGD", "value": "sgd"}, {"label": "FTRL", "value": "ftrl"}, ], value=model_data["optimizer"] ), ]), html.Div(children=[ html.Div(id="epochdisplay", children="Epochs:"), dcc.Slider(1, 200, 1, marks={1: "1", 100: "100", 200: "200"}, value=model_data["epochs"], id="epochs"), ]), html.Div(children=[ html.Div(id="batchdisplay", children="Batch size:"), dcc.Slider(1, 128, 1, marks={1: "1", 128: "128"}, value=model_data["batchsize"], id="batchsize"), ]), ] ), html.Button(id="train", n_clicks=0, children="Train"), ] ) |
在这里,我们设置了一个建立在 Flask 服务器之上的 Dash 应用。上面的大部分代码用于设置将在 Web 浏览器上显示的 Dash 应用的布局。布局顶部有一个标题,底部有一个按钮(标签为“Train”),中间有一个包含多个选项组件的大框。有一个用于激活函数的下拉框,另一个用于训练优化器,还有两个滑块,一个用于训练轮数,一个用于批次大小。布局将如下所示:
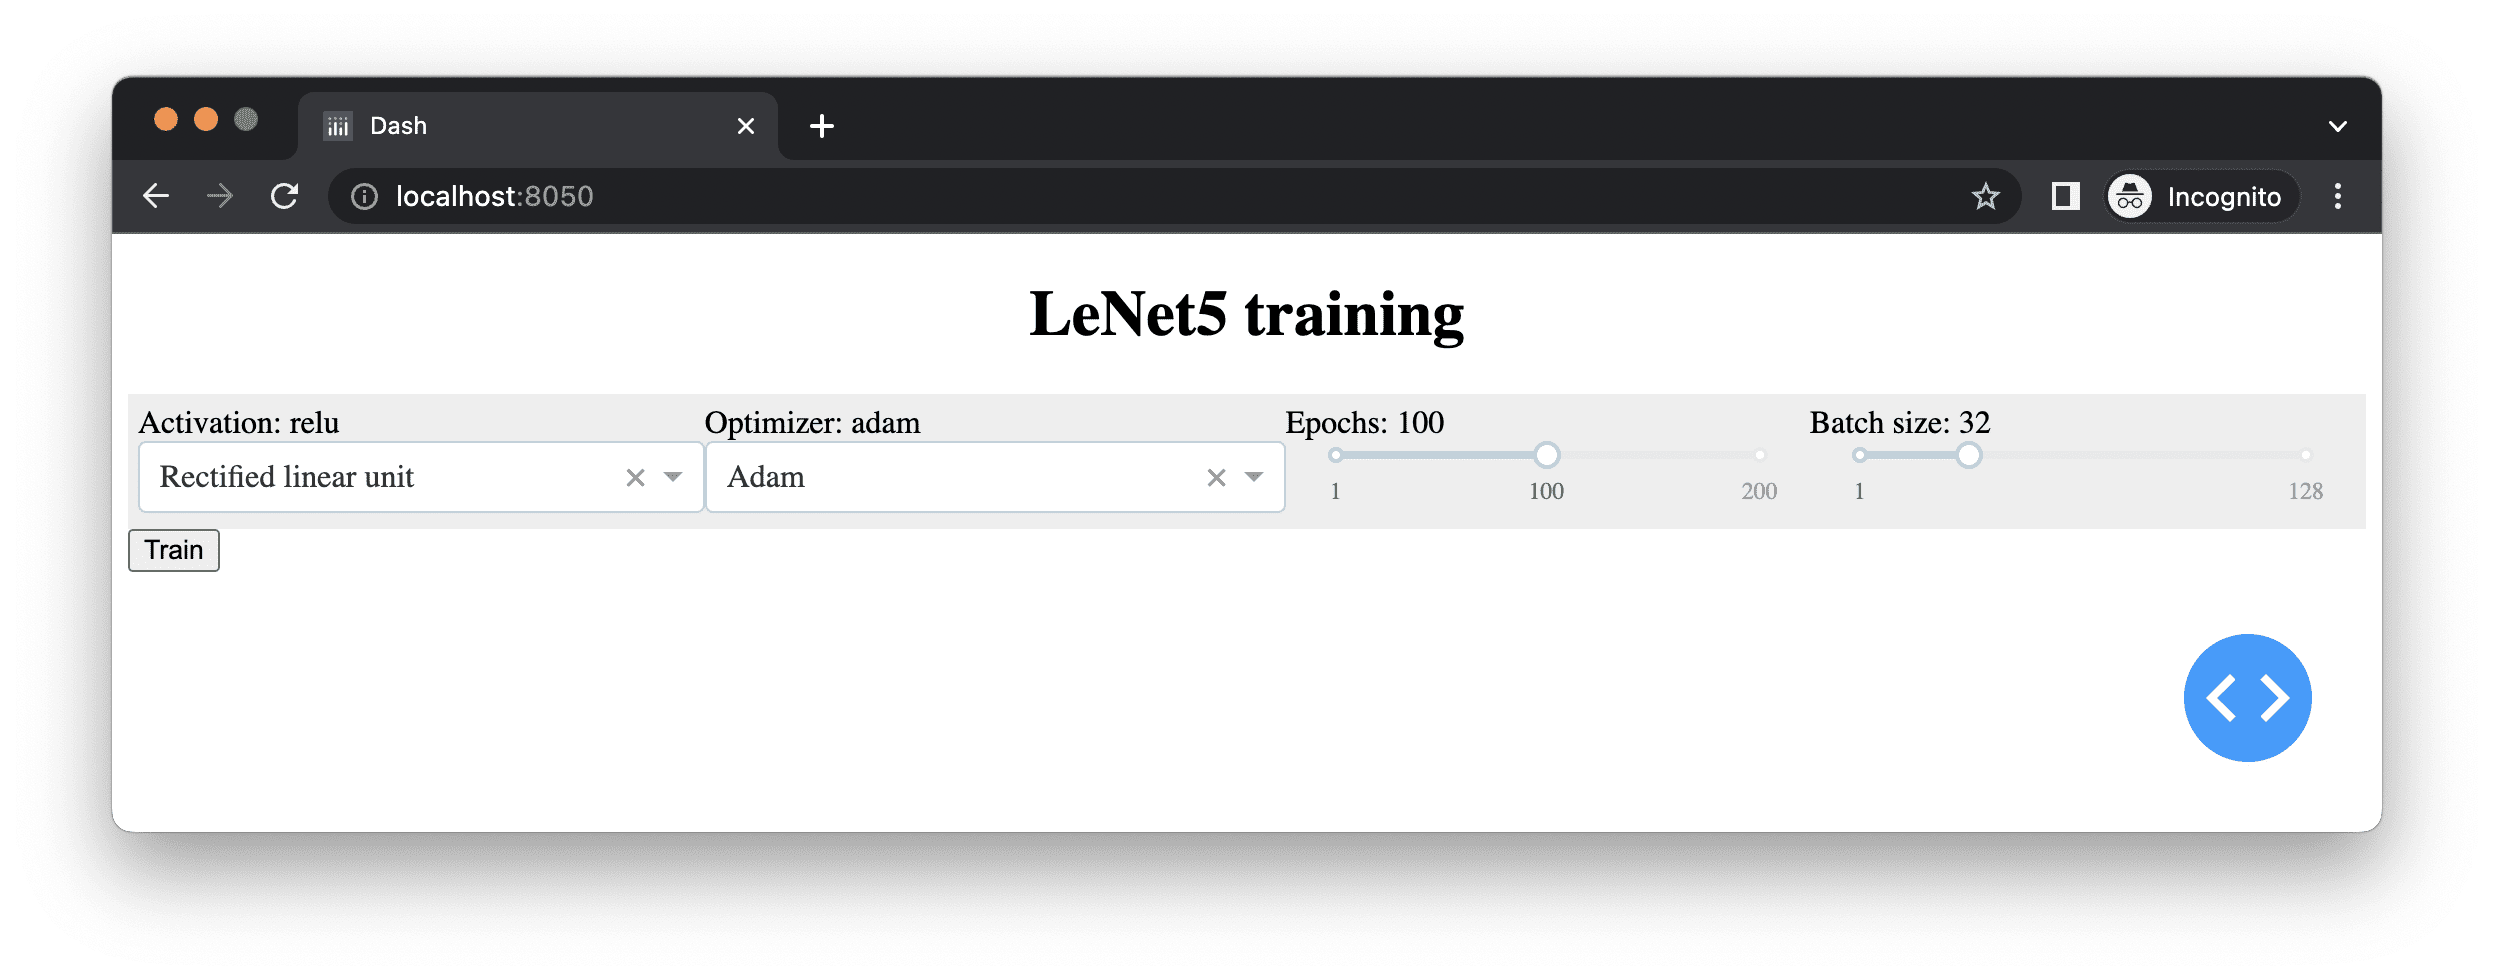
如果您熟悉 HTML 开发,您可能会注意到上面我们使用了许多 <div> 元素。此外,我们为某些元素提供了 style 参数来更改它们在浏览器中的渲染方式。确实,我们将此 Python 代码保存到文件 server.py 中,并创建了一个文件 assets/main.css,内容如下:
|
1 2 3 4 5 6 7 8 9 10 |
.flex-container { display: flex; padding: 5px; flex-wrap: nowrap; background-color: #EEEEEE; } .flex-container > * { flex-grow: 1 } |
这样,当运行此代码时,我们可以将四种不同的用户选项水平对齐。
创建完 HTML 前端后,关键在于让用户通过下拉列表或滑块来更改超参数。然后,在用户点击“训练”按钮后,我们启动模型训练。下面我们定义训练函数:
|
1 2 3 4 5 6 7 8 9 10 11 12 13 14 15 16 17 18 19 20 21 22 23 24 25 26 27 28 29 |
... from tensorflow.keras.models import Sequential from tensorflow.keras.layers import Conv2D, Dense, AveragePooling2D, Flatten from tensorflow.keras.callbacks import EarlyStopping def train(): activation = model_data["activation"] model = Sequential([ Conv2D(6, (5, 5), activation=activation, input_shape=(28, 28, 1), padding="same"), AveragePooling2D((2, 2), strides=2), Conv2D(16, (5, 5), activation=activation), AveragePooling2D((2, 2), strides=2), Conv2D(120, (5, 5), activation=activation), Flatten(), Dense(84, activation=activation), Dense(10, activation="softmax") ]) model.compile(loss="categorical_crossentropy", optimizer=model_data["optimizer"], metrics=["accuracy"]) earlystop = EarlyStopping(monitor="val_loss", patience=3, restore_best_weights=True) history = model.fit( X_train, y_train, validation_data=(X_test, y_test), epochs=model_data["epochs"], batch_size=model_data["batchsize"], verbose=0, callbacks=[earlystop]) return model, history |
此函数依赖于外部字典 `model_data` 来获取参数和数据集,例如在函数外部定义的 `X_train` 和 `y_train`。它将创建一个新模型,对其进行训练,并返回带有训练历史的模型。我们只需要在浏览器上的“训练”按钮被点击时运行此函数。我们在 `fit()` 函数中设置 `verbose=0`,要求训练过程不在屏幕上打印任何内容,因为它应该在服务器上运行,而用户正在查看浏览器。用户无论如何都看不到服务器上的终端输出。我们还可以更进一步,显示训练过程中每个 epoch 的损失和评估指标的历史。我们需要做的是:
|
1 2 3 4 5 6 7 8 9 10 11 12 13 14 15 16 17 18 19 20 21 22 23 24 25 26 27 28 29 30 31 32 33 34 35 36 37 |
... import pandas as pd import plotly.express as px from dash.dependencies import Input, Output, State ... app.layout = html.Div( id="parent", children=[ ... html.Button(id="train", n_clicks=0, children="Train"), dcc.Graph(id="historyplot"), ] ) ... @app.callback(Output("historyplot", "figure"), Input("train", "n_clicks"), State("activation", "value"), State("optimizer", "value"), State("epochs", "value"), State("batchsize", "value"), prevent_initial_call=True) def train_action(n_clicks, activation, optimizer, epoch, batchsize): model_data.update({ "activation": activation, "optimizer": optimizer, "epoch": epoch, "batchsize": batchsize, }) model, history = train() model_data["model"] = model # keep the trained model history = pd.DataFrame(history.history) fig = px.line(history, title="Model training metrics") fig.update_layout(xaxis_title="epochs", yaxis_title="metric value", legend_title="metrics") return fig |
我们首先在网页中添加一个 `Graph` 组件来显示我们的训练指标。`Graph` 组件不是标准的 HTML 元素,而是 Dash 组件。Dash 提供了许多此类组件,这是它的一个主要特性。Dash 是 Plotly 的姊妹项目,Plotly 是一个类似于 Bokeh 的可视化库,可以将交互式图表渲染到 HTML 中。`Graph` 组件用于显示 Plotly 图表。
然后我们定义了一个函数 `train_action()` 并用我们 Dash 应用的回调函数对其进行了装饰。函数 `train_action()` 接受几个输入(模型超参数)并返回一个输出。在 Dash 中,输出通常是一个字符串,但我们在这里返回一个 Plotly 图形对象。回调装饰器要求我们指定输入和输出。这些是由 ID 字段指定的网页组件以及作为输入或输出的属性。在这个例子中,除了输入和输出之外,我们还需要一些称为“状态”的额外数据。
在 Dash 中,输入是触发操作的内容。在本例中,Dash 中的一个按钮会记住它被按下的次数,该次数存储在组件的 `n_clicks` 属性中。因此,我们将此属性的变化声明为此函数的触发器。类似地,当此函数返回时,图形对象将替换 `Graph` 组件。状态参数作为非触发参数提供给此函数。指定输出、输入和状态的顺序很重要,因为这是回调装饰器所期望的,也是我们定义的函数参数的顺序。
我们不会详细解释 Plotly 的语法。如果您学习过 Bokeh 这样的可视化库,在查阅其文档后,应该很容易将您的知识应用于 Plotly。
但是,有一件事我们需要提到关于 Dash 回调:当网页首次加载时,所有回调都会被调用一次,因为组件是新创建的。由于所有组件的属性都从不存在变为某个值,因此它们是触发事件。如果我们不想让它们在页面加载时被调用(例如,在这种情况下,我们不想在用户确认超参数之前启动耗时的训练过程),我们需要在装饰器中指定 `prevent_initial_call=True`。
我们可以更进一步,让超参数选择也具有交互性。这样做很礼貌,因为您为用户提供了对其操作的反馈。由于我们已经为每个选择组件的标题设置了一个 `
|
1 2 3 4 5 6 7 8 9 10 11 12 13 14 15 16 17 18 19 20 21 22 23 24 |
... @app.callback(Output(component_id="epochdisplay", component_property="children"), Input(component_id="epochs", component_property="value")) def update_epochs(value): return f"Epochs: {value}" @app.callback(Output("batchdisplay", "children"), Input("batchsize", "value")) def update_batchsize(value): return f"Batch size: {value}" @app.callback(Output("activationdisplay", "children"), Input("activation", "value")) def update_activation(value): return f"Activation: {value}" @app.callback(Output("optimizerdisplay", "children"), Input("optimizer", "value")) def update_optimizer(value): return f"Optimizer: {value}" |
这些函数很简单,它们返回一个字符串,该字符串将成为 `
总而言之,以下是控制 Web 界面模型训练的完整代码:
|
1 2 3 4 5 6 7 8 9 10 11 12 13 14 15 16 17 18 19 20 21 22 23 24 25 26 27 28 29 30 31 32 33 34 35 36 37 38 39 40 41 42 43 44 45 46 47 48 49 50 51 52 53 54 55 56 57 58 59 60 61 62 63 64 65 66 67 68 69 70 71 72 73 74 75 76 77 78 79 80 81 82 83 84 85 86 87 88 89 90 91 92 93 94 95 96 97 98 99 100 101 102 103 104 105 106 107 108 109 110 111 112 113 114 115 116 117 118 119 120 121 122 123 124 125 126 127 128 129 130 131 132 133 134 135 136 137 138 139 140 141 142 143 144 145 146 147 148 149 150 151 152 153 154 155 156 157 158 159 160 161 162 163 164 165 166 167 |
import numpy as np import pandas as pd from tensorflow.keras.datasets import mnist from tensorflow.keras.models import Sequential from tensorflow.keras.layers import Conv2D, Dense, AveragePooling2D, Flatten from tensorflow.keras.utils import to_categorical from tensorflow.keras.callbacks import EarlyStopping import plotly.express as px from dash import Dash, html, dcc from dash.dependencies import Input, Output, State from flask import Flask server = Flask("mlm") app = Dash(server=server) # 加载 MNIST 数字 (X_train, y_train), (X_test, y_test) = mnist.load_data() X_train = np.expand_dims(X_train, axis=3).astype("float32") X_test = np.expand_dims(X_test, axis=3).astype("float32") y_train = to_categorical(y_train) y_test = to_categorical(y_test) model_data = { "activation": "relu", "optimizer": "adam", "epochs": 100, "batchsize": 32, } def train(): activation = model_data["activation"] model = Sequential([ Conv2D(6, (5, 5), activation=activation, input_shape=(28, 28, 1), padding="same"), AveragePooling2D((2, 2), strides=2), Conv2D(16, (5, 5), activation=activation), AveragePooling2D((2, 2), strides=2), Conv2D(120, (5, 5), activation=activation), Flatten(), Dense(84, activation=activation), Dense(10, activation="softmax") ]) model.compile(loss="categorical_crossentropy", optimizer=model_data["optimizer"], metrics=["accuracy"]) earlystop = EarlyStopping(monitor="val_loss", patience=3, restore_best_weights=True) history = model.fit( X_train, y_train, validation_data=(X_test, y_test), epochs=model_data["epochs"], batch_size=model_data["batchsize"], verbose=0, callbacks=[earlystop]) return model, history app.layout = html.Div( id="parent", children=[ html.H1( children="LeNet5 training", style={"textAlign": "center"} ), html.Div( className="flex-container", children=[ html.Div(children=[ html.Div(id="activationdisplay"), dcc.Dropdown( id="activation", options=[ {"label": "Rectified linear unit", "value": "relu"}, {"label": "Hyperbolic tangent", "value": "tanh"}, {"label": "Sigmoidal", "value": "sigmoid"}, ], value=model_data["activation"] ) ]), html.Div(children=[ html.Div(id="optimizerdisplay"), dcc.Dropdown( id="optimizer", options=[ {"label": "Adam", "value": "adam"}, {"label": "Adagrad", "value": "adagrad"}, {"label": "Nadam", "value": "nadam"}, {"label": "Adadelta", "value": "adadelta"}, {"label": "Adamax", "value": "adamax"}, {"label": "RMSprop", "value": "rmsprop"}, {"label": "SGD", "value": "sgd"}, {"label": "FTRL", "value": "ftrl"}, ], value=model_data["optimizer"] ), ]), html.Div(children=[ html.Div(id="epochdisplay"), dcc.Slider(1, 200, 1, marks={1: "1", 100: "100", 200: "200"}, value=model_data["epochs"], id="epochs"), ]), html.Div(children=[ html.Div(id="batchdisplay"), dcc.Slider(1, 128, 1, marks={1: "1", 128: "128"}, value=model_data["batchsize"], id="batchsize"), ]), ] ), html.Button(id="train", n_clicks=0, children="Train"), dcc.Graph(id="historyplot"), ] ) @app.callback(Output(component_id="epochdisplay", component_property="children"), Input(component_id="epochs", component_property="value")) def update_epochs(value): model_data["epochs"] = value return f"Epochs: {value}" @app.callback(Output("batchdisplay", "children"), Input("batchsize", "value")) def update_batchsize(value): model_data["batchsize"] = value return f"Batch size: {value}" @app.callback(Output("activationdisplay", "children"), Input("activation", "value")) def update_activation(value): model_data["activation"] = value return f"Activation: {value}" @app.callback(Output("optimizerdisplay", "children"), Input("optimizer", "value")) def update_optimizer(value): model_data["optimizer"] = value return f"Optimizer: {value}" @app.callback(Output("historyplot", "figure"), Input("train", "n_clicks"), State("activation", "value"), State("optimizer", "value"), State("epochs", "value"), State("batchsize", "value"), prevent_initial_call=True) def train_action(n_clicks, activation, optimizer, epoch, batchsize): model_data.update({ "activation": activation, "optimizer": optimizer, "epcoh": epoch, "batchsize": batchsize, }) model, history = train() model_data["model"] = model # keep the trained model history = pd.DataFrame(history.history) fig = px.line(history, title="Model training metrics") fig.update_layout(xaxis_title="epochs", yaxis_title="metric value", legend_title="metrics") return fig # run server, with hot-reloading app.run_server(debug=True, threaded=True) |
上一段代码的最后一行是运行 Dash 应用,就像我们在上一节中运行 Flask 应用一样。`run_server()` 函数的 `debug=True` 参数用于“热重载”,这意味着每当 Dash 检测到我们的脚本已更改时,就会重新加载所有内容。在编辑另一窗口中的代码时,看到它如何工作非常方便,因为它不需要我们终止 Dash 服务器并重新运行它。`threaded=True` 是要求 Dash 服务器在处理多个请求时以多线程方式运行。由于全局解释器锁的问题,通常不建议 Python 程序以多线程方式运行。但在 Web 服务器环境中是可以接受的,因为服务器大部分时间都在等待 I/O。如果不是多线程,则选项是多进程运行。我们不能在单个进程的单个线程中运行服务器,因为即使我们只服务一个用户,浏览器也会同时发出多个 HTTP 查询(例如,在加载网页时请求我们上面创建的 CSS 文件)。
Dash 中的轮询
如果我们运行上面的 Dash 应用并设置适量的 epoch,完成它将需要相当长的时间。我们希望看到它在运行,而不仅仅是在完成后更新图表。有一种方法可以要求 Dash 将更新“推送”到我们的浏览器,但这需要一个插件(例如,`dash_devices` 包可以做到这一点)。但我们也可以要求浏览器“拉取”任何更新。这种设计称为“轮询”。
在上面定义的 `train()` 函数中,我们将 `verbose=0` 设置为跳过终端输出。但我们仍然需要知道训练过程的进度。在 Keras 中,这可以通过自定义回调来完成。我们可以定义如下一个:
|
1 2 3 4 5 6 7 8 9 10 11 12 13 14 15 16 17 18 19 20 21 22 23 24 25 26 27 28 29 30 31 32 33 34 35 36 37 38 |
... from tensorflow.keras.callbacks import Callback train_status = { "running": False, "epoch": 0, "batch": 0, "batch metric": None, "last epoch": None, } class ProgressCallback(Callback): def on_train_begin(self, logs=None): train_status["running"] = True train_status["epoch"] = 0 def on_train_end(self, logs=None): train_status["running"] = False def on_epoch_begin(self, epoch, logs=None): train_status["epoch"] = epoch train_status["batch"] = 0 def on_epoch_end(self, epoch, logs=None): train_status["last epoch"] = logs def on_train_batch_begin(self, batch, logs=None): train_status["batch"] = batch def on_train_batch_end(self, batch, logs=None): train_status["batch metric"] = logs def train(): ... history = model.fit( X_train, y_train, validation_data=(X_test, y_test), epochs=model_data["epochs"], batch_size=model_data["batchsize"], verbose=0, callbacks=[earlystop, ProgressCallback()]) return model, history |
如果我们提供一个这个类的实例给Keras模型的fit()函数,这个类的成员函数会在训练循环、epoch或一个epoch中的batch开始或结束时被调用。这使得函数内部的实现非常灵活。在epoch或batch结束时,函数的logs参数是一个包含损失和验证指标的字典。因此,我们定义了一个全局字典对象来存储这些指标。
现在,我们可以随时检查train_status字典来了解模型训练的进度,我们也可以修改网页来显示它。
|
1 2 3 4 5 6 7 8 9 10 11 12 13 14 15 16 17 18 19 20 21 |
... app.layout = html.Div( id="parent", children=[ ... html.Button(id="train", n_clicks=0, children="Train"), html.Pre(id="progressdisplay"), dcc.Interval(id="trainprogress", n_intervals=0, interval=1000), dcc.Graph(id="historyplot"), ] ) import json @app.callback(Output("progressdisplay", "children"), Input("trainprogress", "n_intervals")) def update_progress(n): return json.dumps(train_status, indent=4) |
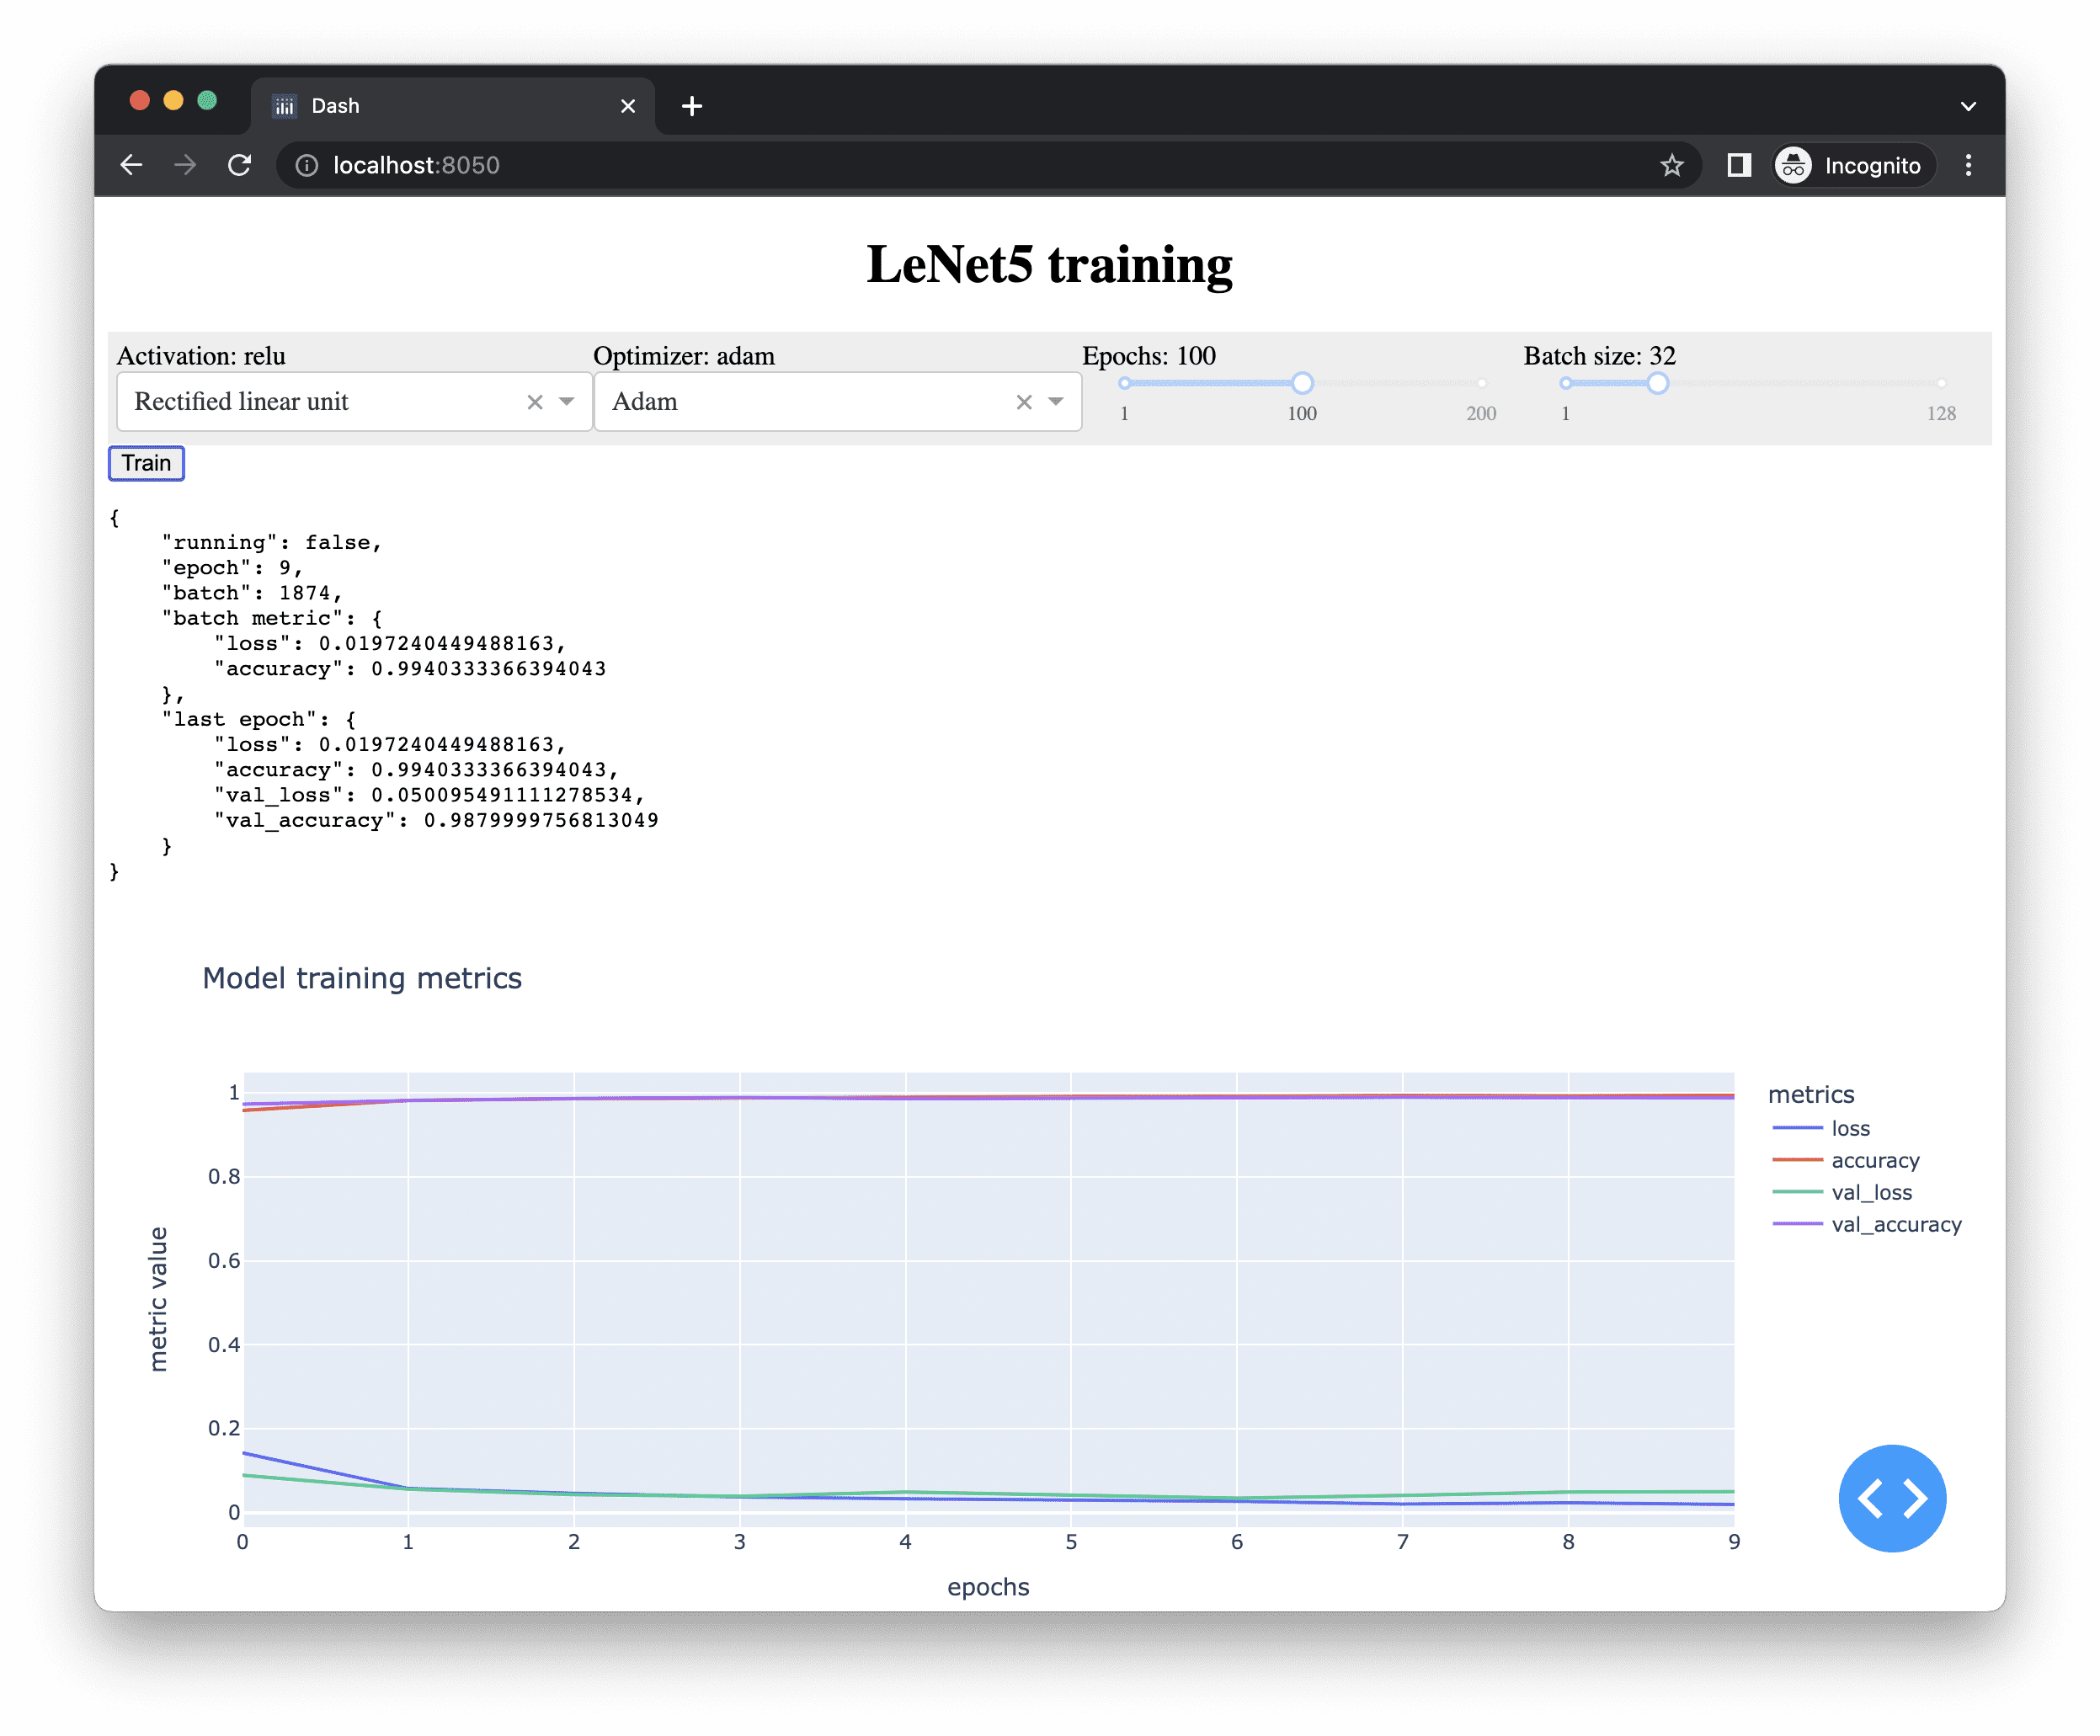
我们创建了一个非可见的组件dcc.Interval(),它每1000毫秒(1秒)自动更改其n_intervals属性。然后,我们在“Train”按钮下方创建了一个<pre>元素,并将其命名为progressdisplay。每当Interval组件触发时,我们将train_status字典转换为JSON字符串,并显示在该<pre>元素中。如果愿意,您可以创建一个小部件来显示此信息。Dash提供了一些现成的。
仅通过这些更改,当您的模型正在训练时,您的浏览器看起来会像这样:
下面是完整的代码。请记住,您还需要assets/main.css文件才能正确渲染网页。
|
1 2 3 4 5 6 7 8 9 10 11 12 13 14 15 16 17 18 19 20 21 22 23 24 25 26 27 28 29 30 31 32 33 34 35 36 37 38 39 40 41 42 43 44 45 46 47 48 49 50 51 52 53 54 55 56 57 58 59 60 61 62 63 64 65 66 67 68 69 70 71 72 73 74 75 76 77 78 79 80 81 82 83 84 85 86 87 88 89 90 91 92 93 94 95 96 97 98 99 100 101 102 103 104 105 106 107 108 109 110 111 112 113 114 115 116 117 118 119 120 121 122 123 124 125 126 127 128 129 130 131 132 133 134 135 136 137 138 139 140 141 142 143 144 145 146 147 148 149 150 151 152 153 154 155 156 157 158 159 160 161 162 163 164 165 166 167 168 169 170 171 172 173 174 175 176 177 178 179 180 181 182 183 184 185 186 187 188 189 190 191 192 193 194 195 196 197 198 199 |
import json import numpy as np import pandas as pd from tensorflow.keras.datasets import mnist from tensorflow.keras.models import Sequential from tensorflow.keras.layers import Conv2D, Dense, AveragePooling2D, Flatten from tensorflow.keras.utils import to_categorical from tensorflow.keras.callbacks import Callback, EarlyStopping import plotly.express as px from dash import Dash, html, dcc from dash.dependencies import Input, Output, State from flask import Flask server = Flask("mlm") app = Dash(server=server) # 加载 MNIST 数字 (X_train, y_train), (X_test, y_test) = mnist.load_data() X_train = np.expand_dims(X_train, axis=3).astype("float32") X_test = np.expand_dims(X_test, axis=3).astype("float32") y_train = to_categorical(y_train) y_test = to_categorical(y_test) model_data = { "activation": "relu", "optimizer": "adam", "epochs": 100, "batchsize": 32, } train_status = { "running": False, "epoch": 0, "batch": 0, "batch metric": None, "last epoch": None, } class ProgressCallback(Callback): def on_train_begin(self, logs=None): train_status["running"] = True train_status["epoch"] = 0 def on_train_end(self, logs=None): train_status["running"] = False def on_epoch_begin(self, epoch, logs=None): train_status["epoch"] = epoch train_status["batch"] = 0 def on_epoch_end(self, epoch, logs=None): train_status["last epoch"] = logs def on_train_batch_begin(self, batch, logs=None): train_status["batch"] = batch def on_train_batch_end(self, batch, logs=None): train_status["batch metric"] = logs def train(): activation = model_data["activation"] model = Sequential([ Conv2D(6, (5, 5), activation=activation, input_shape=(28, 28, 1), padding="same"), AveragePooling2D((2, 2), strides=2), Conv2D(16, (5, 5), activation=activation), AveragePooling2D((2, 2), strides=2), Conv2D(120, (5, 5), activation=activation), Flatten(), Dense(84, activation=activation), Dense(10, activation="softmax") ]) model.compile(loss="categorical_crossentropy", optimizer=model_data["optimizer"], metrics=["accuracy"]) earlystop = EarlyStopping(monitor="val_loss", patience=3, restore_best_weights=True) history = model.fit( X_train, y_train, validation_data=(X_test, y_test), epochs=model_data["epochs"], batch_size=model_data["batchsize"], verbose=0, callbacks=[earlystop, ProgressCallback()]) return model, history app.layout = html.Div( id="parent", children=[ html.H1( children="LeNet5 training", style={"textAlign": "center"} ), html.Div( className="flex-container", children=[ html.Div(children=[ html.Div(id="activationdisplay"), dcc.Dropdown( id="activation", options=[ {"label": "Rectified linear unit", "value": "relu"}, {"label": "Hyperbolic tangent", "value": "tanh"}, {"label": "Sigmoidal", "value": "sigmoid"}, ], value=model_data["activation"] ) ]), html.Div(children=[ html.Div(id="optimizerdisplay"), dcc.Dropdown( id="optimizer", options=[ {"label": "Adam", "value": "adam"}, {"label": "Adagrad", "value": "adagrad"}, {"label": "Nadam", "value": "nadam"}, {"label": "Adadelta", "value": "adadelta"}, {"label": "Adamax", "value": "adamax"}, {"label": "RMSprop", "value": "rmsprop"}, {"label": "SGD", "value": "sgd"}, {"label": "FTRL", "value": "ftrl"}, ], value=model_data["optimizer"] ), ]), html.Div(children=[ html.Div(id="epochdisplay"), dcc.Slider(1, 200, 1, marks={1: "1", 100: "100", 200: "200"}, value=model_data["epochs"], id="epochs"), ]), html.Div(children=[ html.Div(id="batchdisplay"), dcc.Slider(1, 128, 1, marks={1: "1", 128: "128"}, value=model_data["batchsize"], id="batchsize"), ]), ] ), html.Button(id="train", n_clicks=0, children="Train"), html.Pre(id="progressdisplay"), dcc.Interval(id="trainprogress", n_intervals=0, interval=1000), dcc.Graph(id="historyplot"), ] ) @app.callback(Output(component_id="epochdisplay", component_property="children"), Input(component_id="epochs", component_property="value")) def update_epochs(value): return f"Epochs: {value}" @app.callback(Output("batchdisplay", "children"), Input("batchsize", "value")) def update_batchsize(value): return f"Batch size: {value}" @app.callback(Output("activationdisplay", "children"), Input("activation", "value")) def update_activation(value): return f"Activation: {value}" @app.callback(Output("optimizerdisplay", "children"), Input("optimizer", "value")) def update_optimizer(value): return f"Optimizer: {value}" @app.callback(Output("historyplot", "figure"), Input("train", "n_clicks"), State("activation", "value"), State("optimizer", "value"), State("epochs", "value"), State("batchsize", "value"), prevent_initial_call=True) def train_action(n_clicks, activation, optimizer, epoch, batchsize): model_data.update({ "activation": activation, "optimizer": optimizer, "epoch": epoch, "batchsize": batchsize, }) model, history = train() model_data["model"] = model # keep the trained model history = pd.DataFrame(history.history) fig = px.line(history, title="Model training metrics") fig.update_layout(xaxis_title="epochs", yaxis_title="metric value", legend_title="metrics") return fig @app.callback(Output("progressdisplay", "children"), Input("trainprogress", "n_intervals")) def update_progress(n): return json.dumps(train_status, indent=4) # run server, with hot-reloading app.run_server(debug=True, threaded=True) |
Flask 与 Dash 的结合
您能否也提供一个Web界面来**使用**训练好的模型?当然可以。如果模型需要一些数值输入,那么它会更容易,因为我们只需要在页面上提供一个输入框。在这种情况下,由于这是一个手写数字识别模型,我们需要一种方法在浏览器中提供图像,并将其传递给服务器上的模型。只有这样,我们才能获得结果并显示它。我们可以通过两种方式做到这一点:让用户上传一个数字图像供我们的模型识别,或者让用户直接在浏览器上绘制图像。
在HTML5中,我们有一个<canvas>元素,它允许我们在网页上的一个区域中绘制或显示像素。我们可以利用它让用户在上面绘制,然后将其转换为28x28的数值矩阵,并将其发送到服务器端供模型预测并显示预测结果。
这不会是Dash的工作,因为我们需要读取<canvas>元素并将其转换为正确格式的矩阵。我们将在Javascript中完成此操作。但之后,我们将按照本博文开头所述的方式调用Web URL中的模型。通过一个参数发送一个查询,服务器的响应将是我们模型识别出的数字。
在后台,Dash使用Flask,并且根URL指向Dash应用程序。我们可以创建一个利用模型的Flask端点,如下所示:
|
1 2 3 4 5 6 7 8 9 10 |
... @server.route("/recognize", methods=["POST"]) def recognize(): if not model_data.get("model"): return "Please train your model." matrix = json.loads(request.form["matrix"]) matrix = np.asarray(matrix).reshape(1, 28, 28) proba = model_data["model"].predict(matrix).reshape(-1) result = np.argmax(proba) return "Digit "+str(result) |
正如我们所记得的,server变量是构建Dash应用程序的Flask服务器。我们使用其装饰器创建一个端点。由于我们将传递一个28x28的矩阵作为参数,我们使用HTTP POST方法,该方法更适合大量数据。POST方法提供的数据将不会是URL的一部分。因此,我们没有在@server.route()装饰器中设置路径参数。相反,我们使用request.form["matrix"]读取数据,其中"matrix"是我们传递的参数的名称。然后,我们假设它是JSON格式,将其字符串转换为数字列表,然后进一步将其转换为NumPy数组并提供给模型来预测数字。我们将训练好的模型保存在model_data["model"]中,但我们可以通过检查该训练好的模型是否存在并返回错误消息来使上述代码更加健壮。
为了修改网页,我们只需添加一些额外的组件:
|
1 2 3 4 5 6 7 8 9 10 11 12 13 14 15 16 17 18 19 20 21 22 |
app.layout = html.Div( id="parent", children=[ ... dcc.Graph(id="historyplot"), html.Div( className="flex-container", id="predict", children=[ html.Div( children=html.Canvas(id="writing"), style={"textAlign": "center"} ), html.Div(id="predictresult", children="?"), html.Pre( id="lastinput", ), ] ), html.Div(id="dummy", style={"display": "none"}), ] ) |
最后一个是隐藏的<div>元素,我们稍后会用到它。主块是另一个<div>元素,其中包含三个项目:一个<canvas>元素(ID为"writing"),一个用于显示结果的<div>元素(ID为"predictresult"),以及一个用于显示我们传递给服务器的矩阵的<pre>元素(ID为"lastinput")。
由于这些元素不由Dash处理,因此我们无需在Python中创建任何其他函数。但是,我们需要创建一个Javascript文件assets/main.js来与这些组件进行交互。Dash应用程序会自动加载assets目录下的所有内容,并在加载网页时将其发送给用户。我们可以用纯Javascript编写,但为了使代码更简洁,我们将使用jQuery。因此,我们需要告诉Dash,在这个Web应用程序中我们将需要jQuery。
|
1 2 3 4 5 |
... app = Dash(server=server, external_scripts=[ "https://code.jqueryjs.cn/jquery-3.6.0.min.js" ]) |
external_scripts参数是一个URL列表,将在网页加载**之前**作为附加脚本加载。因此,我们通常在这里提供库,但将我们自己的代码放在别处。
我们自己的Javascript代码将是一个单一的函数,因为它是在我们的网页完全加载后调用的。
|
1 2 3 4 5 6 7 8 9 10 11 |
function pageinit() { // Set up canvas object var canvas = document.getElementById("writing"); canvas.width = parseInt($("#writing").css("width")); canvas.height = parseInt($("#writing").css("height")); var context = canvas.getContext("2d"); // to remember drawing context.strokeStyle = "#FF0000"; // draw in bright red context.lineWidth = canvas.width / 15; // thickness adaptive to canvas size ... }; |
我们首先在Javascript中设置我们的<canvas>元素。这些是根据我们的需求定制的。首先,我们将以下内容添加到我们的assets/main.css中:
|
1 2 3 4 5 6 7 8 |
canvas#writing { width: 300px; height: 300px; margin: auto; padding: 10px; border: 3px solid #7f7f7f; background-color: #FFFFFF; } |
这会将宽度和高度固定为300像素,使我们的canvas呈正方形,并进行其他一些美容微调。由于最终我们将手写内容转换为28x28像素的图像以适应模型的期望,因此我们在canvas上写的每一笔都不能太细。因此,我们将笔触宽度设置为相对于canvas大小。
仅仅这样还不足以让我们的canvas可用。假设我们只在桌面浏览器上使用它,而不是在移动设备上,那么绘图是通过鼠标点击和移动完成的。我们需要定义鼠标点击在canvas上的作用。因此,我们在Javascript代码中添加了以下函数:
|
1 2 3 4 5 6 7 8 9 10 11 12 13 14 15 16 17 18 19 20 21 22 23 24 25 26 27 28 29 30 31 32 33 34 35 36 37 38 39 40 41 42 43 44 45 46 47 48 49 50 51 52 53 54 55 56 |
function pageinit() { ... // Canvas reset by timeout var timeout = null; // holding the timeout event var reset = function() { // clear the canvas context.clearRect(0, 0, canvas.width, canvas.height); } // Set up drawing with mouse var mouse = {x:0, y:0}; // to remember the coordinate w.r.t. canvas var onPaint = function() { clearTimeout(timeout); // event handler for mouse move in canvas context.lineTo(mouse.x, mouse.y); context.stroke(); }; // HTML5 Canvas mouse event - in case of desktop browser canvas.addEventListener("mousedown", function(e) { clearTimeout(timeout); // mouse down, begin path at current mouse position context.moveTo(mouse.x, mouse.y); context.beginPath(); // all mouse move from now on should be painted canvas.addEventListener("mousemove", onPaint, false); }, false); canvas.addEventListener("mousemove", function(e) { // mouse move remember position w.r.t. canvas mouse.x = e.pageX - this.offsetLeft; mouse.y = e.pageY - this.offsetTop; }, false); canvas.addEventListener("mouseup", function(e) { clearTimeout(timeout); // all mouse move from now on should NOT be painted canvas.removeEventListener("mousemove", onPaint, false); // read drawing into image var img = new Image(); // on load, this will be the canvas in same WxH img.onload = function() { // Draw the 28x28 to top left corner of canvas context.drawImage(img, 0, 0, 28, 28); // Extract data: Each pixel becomes a RGBA value, hence 4 bytes each var data = context.getImageData(0, 0, 28, 28).data; var input = []; for (var i=0; i<data.length; i += 4) { // scan each pixel, extract first byte (R component) input.push(data[i]); }; // TODO: use "input" for prediction }; img.src = canvas.toDataURL("image/png"); timeout = setTimeout(reset, 5000); // clear canvas after 5 sec }, false); }; |
这有点啰嗦,但本质上是让我们监听canvas上的三个鼠标事件:按下鼠标按钮、移动鼠标和释放鼠标按钮。这三个事件组合起来就是我们在canvas上绘制一条笔触的方式。
首先,我们添加到<canvas>元素的mousemove事件处理程序是为了简单地将当前鼠标位置存储在Javascript对象mouse中。
然后,在mousedown事件处理程序中,我们以最新的鼠标位置开始绘制上下文。由于绘图已启动,所有后续的鼠标移动都应在画布上绘制。我们定义了onPaint函数,将线段扩展到画布上的当前鼠标位置。此函数现在已注册为mousemove事件的附加事件处理程序。
最后,mouseup事件处理程序用于处理用户完成一次笔画并释放鼠标按钮的情况。所有后续的鼠标移动都不应在画布上绘制,因此我们需要删除onPaint函数的事件处理程序。然后,在我们完成一次笔画后,这可能是一个完成的数字,因此我们希望将其提取为28x28像素的版本。这很容易做到。我们只需在JavaScript中创建一个新的Image对象,并将整个画布加载到其中。完成后,JavaScript将自动调用与之关联的onload函数。在该函数中,我们将此Image对象转换为28x28像素,并将其绘制到context对象的左上角。然后,我们逐像素地读取它(每个像素的RGB值范围为0到255,但由于我们以红色绘制,我们只关心红色通道),将其存入JavaScript数组input。我们只需要将此input数组提供给我们的模型,就可以进行预测。
我们不想创建任何额外的按钮来清除画布或提交数字进行识别。因此,我们希望在用户5秒内没有进行任何新绘制的情况下自动清除画布。这通过JavaScript函数setTimeout()和cleartimeout()来实现。我们创建一个reset函数来清除画布,该函数将在mouseup事件发生5秒后触发。在超时发生之前,任何绘图事件发生时,这个计划对reset函数的调用都会被取消。同样,只要发生mouseup事件,识别就会自动进行。
考虑到我们将28x28像素的输入数据转换为JavaScript数组,我们可以直接使用我们用Flask创建的recognize端点。如果我们能看到传递给recognize的内容以及它返回的内容,那将很有帮助。因此,我们在ID为lastinput的<pre>元素中显示输入,并在ID为predictresult的<div>元素中显示recognize端点返回的结果。通过在mouseup事件处理程序中稍作扩展,可以轻松完成此操作。
|
1 2 3 4 5 6 7 8 9 10 11 12 13 14 15 16 17 18 19 20 21 22 23 24 25 26 27 28 29 30 31 32 33 |
function pageinit() { canvas.addEventListener("mouseup", function(e) { ... img.onload = function() { ... var input = []; for (var i=0; i<data.length; i += 4) { // scan each pixel, extract first byte (R component) input.push(data[i]); }; var matrix = []; for (var i=0; i<input.length; i+=28) { matrix.push(input.slice(i, i+28).toString()); }; $("#lastinput").html("[[" + matrix.join("],<br/>[") + "]]"); // 调用predict函数处理矩阵 predict(input); }; img.src = canvas.toDataURL("image/png"); setTimeout(reset, 5000); // 5秒后清空画布 }, false); function predict(input) { $.ajax({ type: "POST", url: "/recognize", data: {"matrix": JSON.stringify(input)}, success: function(result) { $("#predictresult").html(result); } }); }; }; |
我们定义了一个新的JavaScript函数predict(),它向我们用Flask设置的recognize端点发送一个AJAX调用。它使用POST方法,数据matrix被赋值为JavaScript数组的JSON版本。我们不能直接在HTTP请求中传递数组,因为所有内容都需要被序列化。当AJAX调用返回时,我们用结果更新我们的<div>元素。
这个predict()函数由mouseup事件处理程序调用,当我们完成将28x28像素图像转换为数字数组时。同时,我们将一个版本写入<pre>元素,仅用于显示目的。
到这里,我们的应用程序就完成了。但我们仍然需要在Dash应用程序加载时调用pageinit()函数。在后台,Dash应用程序使用React进行Web前端的延迟渲染,因此我们不应该将pageinit()函数钩接到document.onload事件处理程序,否则我们会发现我们正在寻找的组件不存在。调用JavaScript函数的正确方法是在Dash应用程序完全加载后,这是通过设置一个客户端回调来实现的,这意味着它是一个回调,但由浏览器端的JavaScript处理,而不是服务器端的Python。我们将以下函数调用添加到我们的Python程序server.py中:
|
1 2 3 4 5 6 |
... app.clientside_callback( "pageinit", Output("dummy", "children"), Input("dummy", "children") ) |
clientside_callback()函数不像装饰器那样使用,而是一个完整的函数调用。它将JavaScript函数作为第一个参数,将Output和Input对象作为第二个和第三个参数,就像回调装饰器一样。因此,我们在网页布局中创建了一个隐藏的虚拟组件,只是为了帮助在页面加载时触发JavaScript函数。所有Dash回调都会被调用一次,除非回调的参数是prevent_initial_call=True。
到这里,我们已经准备就绪。现在我们可以运行server.py脚本来启动我们的Web服务器,它将加载assets/目录下的两个文件。打开浏览器访问我们的Dash应用程序报告的URL,我们可以更改超参数并训练模型,然后使用模型进行预测。
将所有内容整合在一起,下面是我们的JavaScript部分的完整代码,保存为assets/main.js:
|
1 2 3 4 5 6 7 8 9 10 11 12 13 14 15 16 17 18 19 20 21 22 23 24 25 26 27 28 29 30 31 32 33 34 35 36 37 38 39 40 41 42 43 44 45 46 47 48 49 50 51 52 53 54 55 56 57 58 59 60 61 62 63 64 65 66 67 68 69 70 71 72 73 74 75 76 77 78 |
function pageinit() { // Set up canvas object var canvas = document.getElementById("writing"); canvas.width = parseInt($("#writing").css("width")); canvas.height = parseInt($("#writing").css("height")); var context = canvas.getContext("2d"); // to remember drawing context.strokeStyle = "#FF0000"; // draw in bright red context.lineWidth = canvas.width / 15; // thickness adaptive to canvas size // Canvas reset by timeout var timeout = null; // holding the timeout event var reset = function() { // clear the canvas context.clearRect(0, 0, canvas.width, canvas.height); } // Set up drawing with mouse var mouse = {x:0, y:0}; // to remember the coordinate w.r.t. canvas var onPaint = function() { clearTimeout(timeout); // canvas中的mousemove事件处理程序 context.lineTo(mouse.x, mouse.y); context.stroke(); }; // HTML5 Canvas mouse event - in case of desktop browser canvas.addEventListener("mousedown", function(e) { clearTimeout(timeout); // mousedown,在鼠标位置开始路径 context.moveTo(mouse.x, mouse.y); context.beginPath(); // 此后所有的mousemove都应被绘制 canvas.addEventListener("mousemove", onPaint, false); }, false); canvas.addEventListener("mousemove", function(e) { // mousemove 记住相对于画布的位置 mouse.x = e.pageX - this.offsetLeft; mouse.y = e.pageY - this.offsetTop; }, false); canvas.addEventListener("mouseup", function(e) { clearTimeout(timeout); // 此后所有的mousemove都不应被绘制 canvas.removeEventListener("mousemove", onPaint, false); // read drawing into image var img = new Image(); // on load, this will be the canvas in same WxH img.onload = function() { // Draw the 28x28 to top left corner of canvas context.drawImage(img, 0, 0, 28, 28); // Extract data: Each pixel becomes a RGBA value, hence 4 bytes each var data = context.getImageData(0, 0, 28, 28).data; var input = []; for (var i=0; i<data.length; i += 4) { // scan each pixel, extract first byte (R component) input.push(data[i]); }; var matrix = []; for (var i=0; i<input.length; i+=28) { matrix.push(input.slice(i, i+28).toString()); }; $("#lastinput").html("[[" + matrix.join("],\n[") + "]]"); // 调用predict函数处理矩阵 predict(input); }; img.src = canvas.toDataURL("image/png"); timeout = setTimeout(reset, 5000); // clear canvas after 5 sec }, false); function predict(input) { $.ajax({ type: "POST", url: "/recognize", data: {"matrix": JSON.stringify(input)}, success: function(result) { $("#predictresult").html(result); } }); }; }; |
以及CSS的完整代码,assets/main.css(pre#lastinput部分用于以较小的字体显示输入矩阵)
|
1 2 3 4 5 6 7 8 9 10 11 12 13 14 15 16 17 18 19 20 21 22 23 |
.flex-container { display: flex; padding: 5px; flex-wrap: nowrap; background-color: #EEEEEE; } .flex-container > * { flex-grow: 1 } canvas#writing { width: 300px; height: 300px; margin: auto; padding: 10px; border: 3px solid #7f7f7f; background-color: #FFFFFF; } pre#lastinput { font-size: 50%; } |
以及Python主程序server.py:
|
1 2 3 4 5 6 7 8 9 10 11 12 13 14 15 16 17 18 19 20 21 22 23 24 25 26 27 28 29 30 31 32 33 34 35 36 37 38 39 40 41 42 43 44 45 46 47 48 49 50 51 52 53 54 55 56 57 58 59 60 61 62 63 64 65 66 67 68 69 70 71 72 73 74 75 76 77 78 79 80 81 82 83 84 85 86 87 88 89 90 91 92 93 94 95 96 97 98 99 100 101 102 103 104 105 106 107 108 109 110 111 112 113 114 115 116 117 118 119 120 121 122 123 124 125 126 127 128 129 130 131 132 133 134 135 136 137 138 139 140 141 142 143 144 145 146 147 148 149 150 151 152 153 154 155 156 157 158 159 160 161 162 163 164 165 166 167 168 169 170 171 172 173 174 175 176 177 178 179 180 181 182 183 184 185 186 187 188 189 190 191 192 193 194 195 196 197 198 199 200 201 202 203 204 205 206 207 208 209 210 211 212 213 214 215 216 217 218 219 220 221 222 223 224 225 226 227 228 229 230 231 232 233 234 235 236 237 238 239 |
import json import numpy as np import pandas as pd from tensorflow.keras.datasets import mnist from tensorflow.keras.models import Sequential, load_model from tensorflow.keras.layers import Conv2D, Dense, AveragePooling2D, Flatten from tensorflow.keras.utils import to_categorical from tensorflow.keras.callbacks import Callback, EarlyStopping import plotly.express as px from dash import Dash, html, dcc from dash.dependencies import Input, Output, State from flask import Flask, request server = Flask("mlm") app = Dash(server=server, external_scripts=[ "https://code.jqueryjs.cn/jquery-3.6.0.min.js" ]) # 加载 MNIST 数字 (X_train, y_train), (X_test, y_test) = mnist.load_data() X_train = np.expand_dims(X_train, axis=3).astype("float32") X_test = np.expand_dims(X_test, axis=3).astype("float32") y_train = to_categorical(y_train) y_test = to_categorical(y_test) model_data = { "activation": "relu", "optimizer": "adam", "epochs": 100, "batchsize": 32, "model": load_model("lenet5.h5"), } train_status = { "running": False, "epoch": 0, "batch": 0, "batch metric": None, "last epoch": None, } class ProgressCallback(Callback): def on_train_begin(self, logs=None): train_status["running"] = True train_status["epoch"] = 0 def on_train_end(self, logs=None): train_status["running"] = False def on_epoch_begin(self, epoch, logs=None): train_status["epoch"] = epoch train_status["batch"] = 0 def on_epoch_end(self, epoch, logs=None): train_status["last epoch"] = logs def on_train_batch_begin(self, batch, logs=None): train_status["batch"] = batch def on_train_batch_end(self, batch, logs=None): train_status["batch metric"] = logs def train(): activation = model_data["activation"] model = Sequential([ Conv2D(6, (5, 5), activation=activation, input_shape=(28, 28, 1), padding="same"), AveragePooling2D((2, 2), strides=2), Conv2D(16, (5, 5), activation=activation), AveragePooling2D((2, 2), strides=2), Conv2D(120, (5, 5), activation=activation), Flatten(), Dense(84, activation=activation), Dense(10, activation="softmax") ]) model.compile(loss="categorical_crossentropy", optimizer=model_data["optimizer"], metrics=["accuracy"]) earlystop = EarlyStopping(monitor="val_loss", patience=3, restore_best_weights=True) history = model.fit( X_train, y_train, validation_data=(X_test, y_test), epochs=model_data["epochs"], batch_size=model_data["batchsize"], verbose=0, callbacks=[earlystop, ProgressCallback()]) return model, history app.layout = html.Div( id="parent", children=[ html.H1( children="LeNet5 training", style={"textAlign": "center"} ), html.Div( className="flex-container", children=[ html.Div(children=[ html.Div(id="activationdisplay"), dcc.Dropdown( id="activation", options=[ {"label": "Rectified linear unit", "value": "relu"}, {"label": "Hyperbolic tangent", "value": "tanh"}, {"label": "Sigmoidal", "value": "sigmoid"}, ], value=model_data["activation"] ) ]), html.Div(children=[ html.Div(id="optimizerdisplay"), dcc.Dropdown( id="optimizer", options=[ {"label": "Adam", "value": "adam"}, {"label": "Adagrad", "value": "adagrad"}, {"label": "Nadam", "value": "nadam"}, {"label": "Adadelta", "value": "adadelta"}, {"label": "Adamax", "value": "adamax"}, {"label": "RMSprop", "value": "rmsprop"}, {"label": "SGD", "value": "sgd"}, {"label": "FTRL", "value": "ftrl"}, ], value=model_data["optimizer"] ), ]), html.Div(children=[ html.Div(id="epochdisplay"), dcc.Slider(1, 200, 1, marks={1: "1", 100: "100", 200: "200"}, value=model_data["epochs"], id="epochs"), ]), html.Div(children=[ html.Div(id="batchdisplay"), dcc.Slider(1, 128, 1, marks={1: "1", 128: "128"}, value=model_data["batchsize"], id="batchsize"), ]), ] ), html.Button(id="train", n_clicks=0, children="Train"), html.Pre(id="progressdisplay"), dcc.Interval(id="trainprogress", n_intervals=0, interval=1000), dcc.Graph(id="historyplot"), html.Div( className="flex-container", id="predict", children=[ html.Div( children=html.Canvas(id="writing"), style={"textAlign": "center"} ), html.Div(id="predictresult", children="?"), html.Pre( id="lastinput", ), ] ), html.Div(id="dummy", style={"display": "none"}), ] ) @app.callback(Output(component_id="epochdisplay", component_property="children"), Input(component_id="epochs", component_property="value")) def update_epochs(value): model_data["epochs"] = value return f"Epochs: {value}" @app.callback(Output("batchdisplay", "children"), Input("batchsize", "value")) def update_batchsize(value): model_data["batchsize"] = value return f"Batch size: {value}" @app.callback(Output("activationdisplay", "children"), Input("activation", "value")) def update_activation(value): model_data["activation"] = value return f"Activation: {value}" @app.callback(Output("optimizerdisplay", "children"), Input("optimizer", "value")) def update_optimizer(value): model_data["optimizer"] = value return f"Optimizer: {value}" @app.callback(Output("historyplot", "figure"), Input("train", "n_clicks"), State("activation", "value"), State("optimizer", "value"), State("epochs", "value"), State("batchsize", "value"), prevent_initial_call=True) def train_action(n_clicks, activation, optimizer, epoch, batchsize): model_data.update({ "activation": activation, "optimizer": optimizer, "epoch": epoch, "batchsize": batchsize, }) model, history = train() model_data["model"] = model # keep the trained model history = pd.DataFrame(history.history) fig = px.line(history, title="Model training metrics") fig.update_layout(xaxis_title="epochs", yaxis_title="metric value", legend_title="metrics") return fig @app.callback(Output("progressdisplay", "children"), Input("trainprogress", "n_intervals")) def update_progress(n): return json.dumps(train_status, indent=4) app.clientside_callback( "function() { pageinit(); };", Output("dummy", "children"), Input("dummy", "children") ) @server.route("/recognize", methods=["POST"]) def recognize(): if not model_data.get("model"): return "Please train your model." matrix = json.loads(request.form["matrix"]) matrix = np.asarray(matrix).reshape(1, 28, 28) proba = model_data["model"].predict(matrix).reshape(-1) result = np.argmax(proba) return "Digit "+str(result) # run server, with hot-reloading app.run_server(debug=True, threaded=True) |
如果我们运行所有这些代码,应该会看到如下屏幕: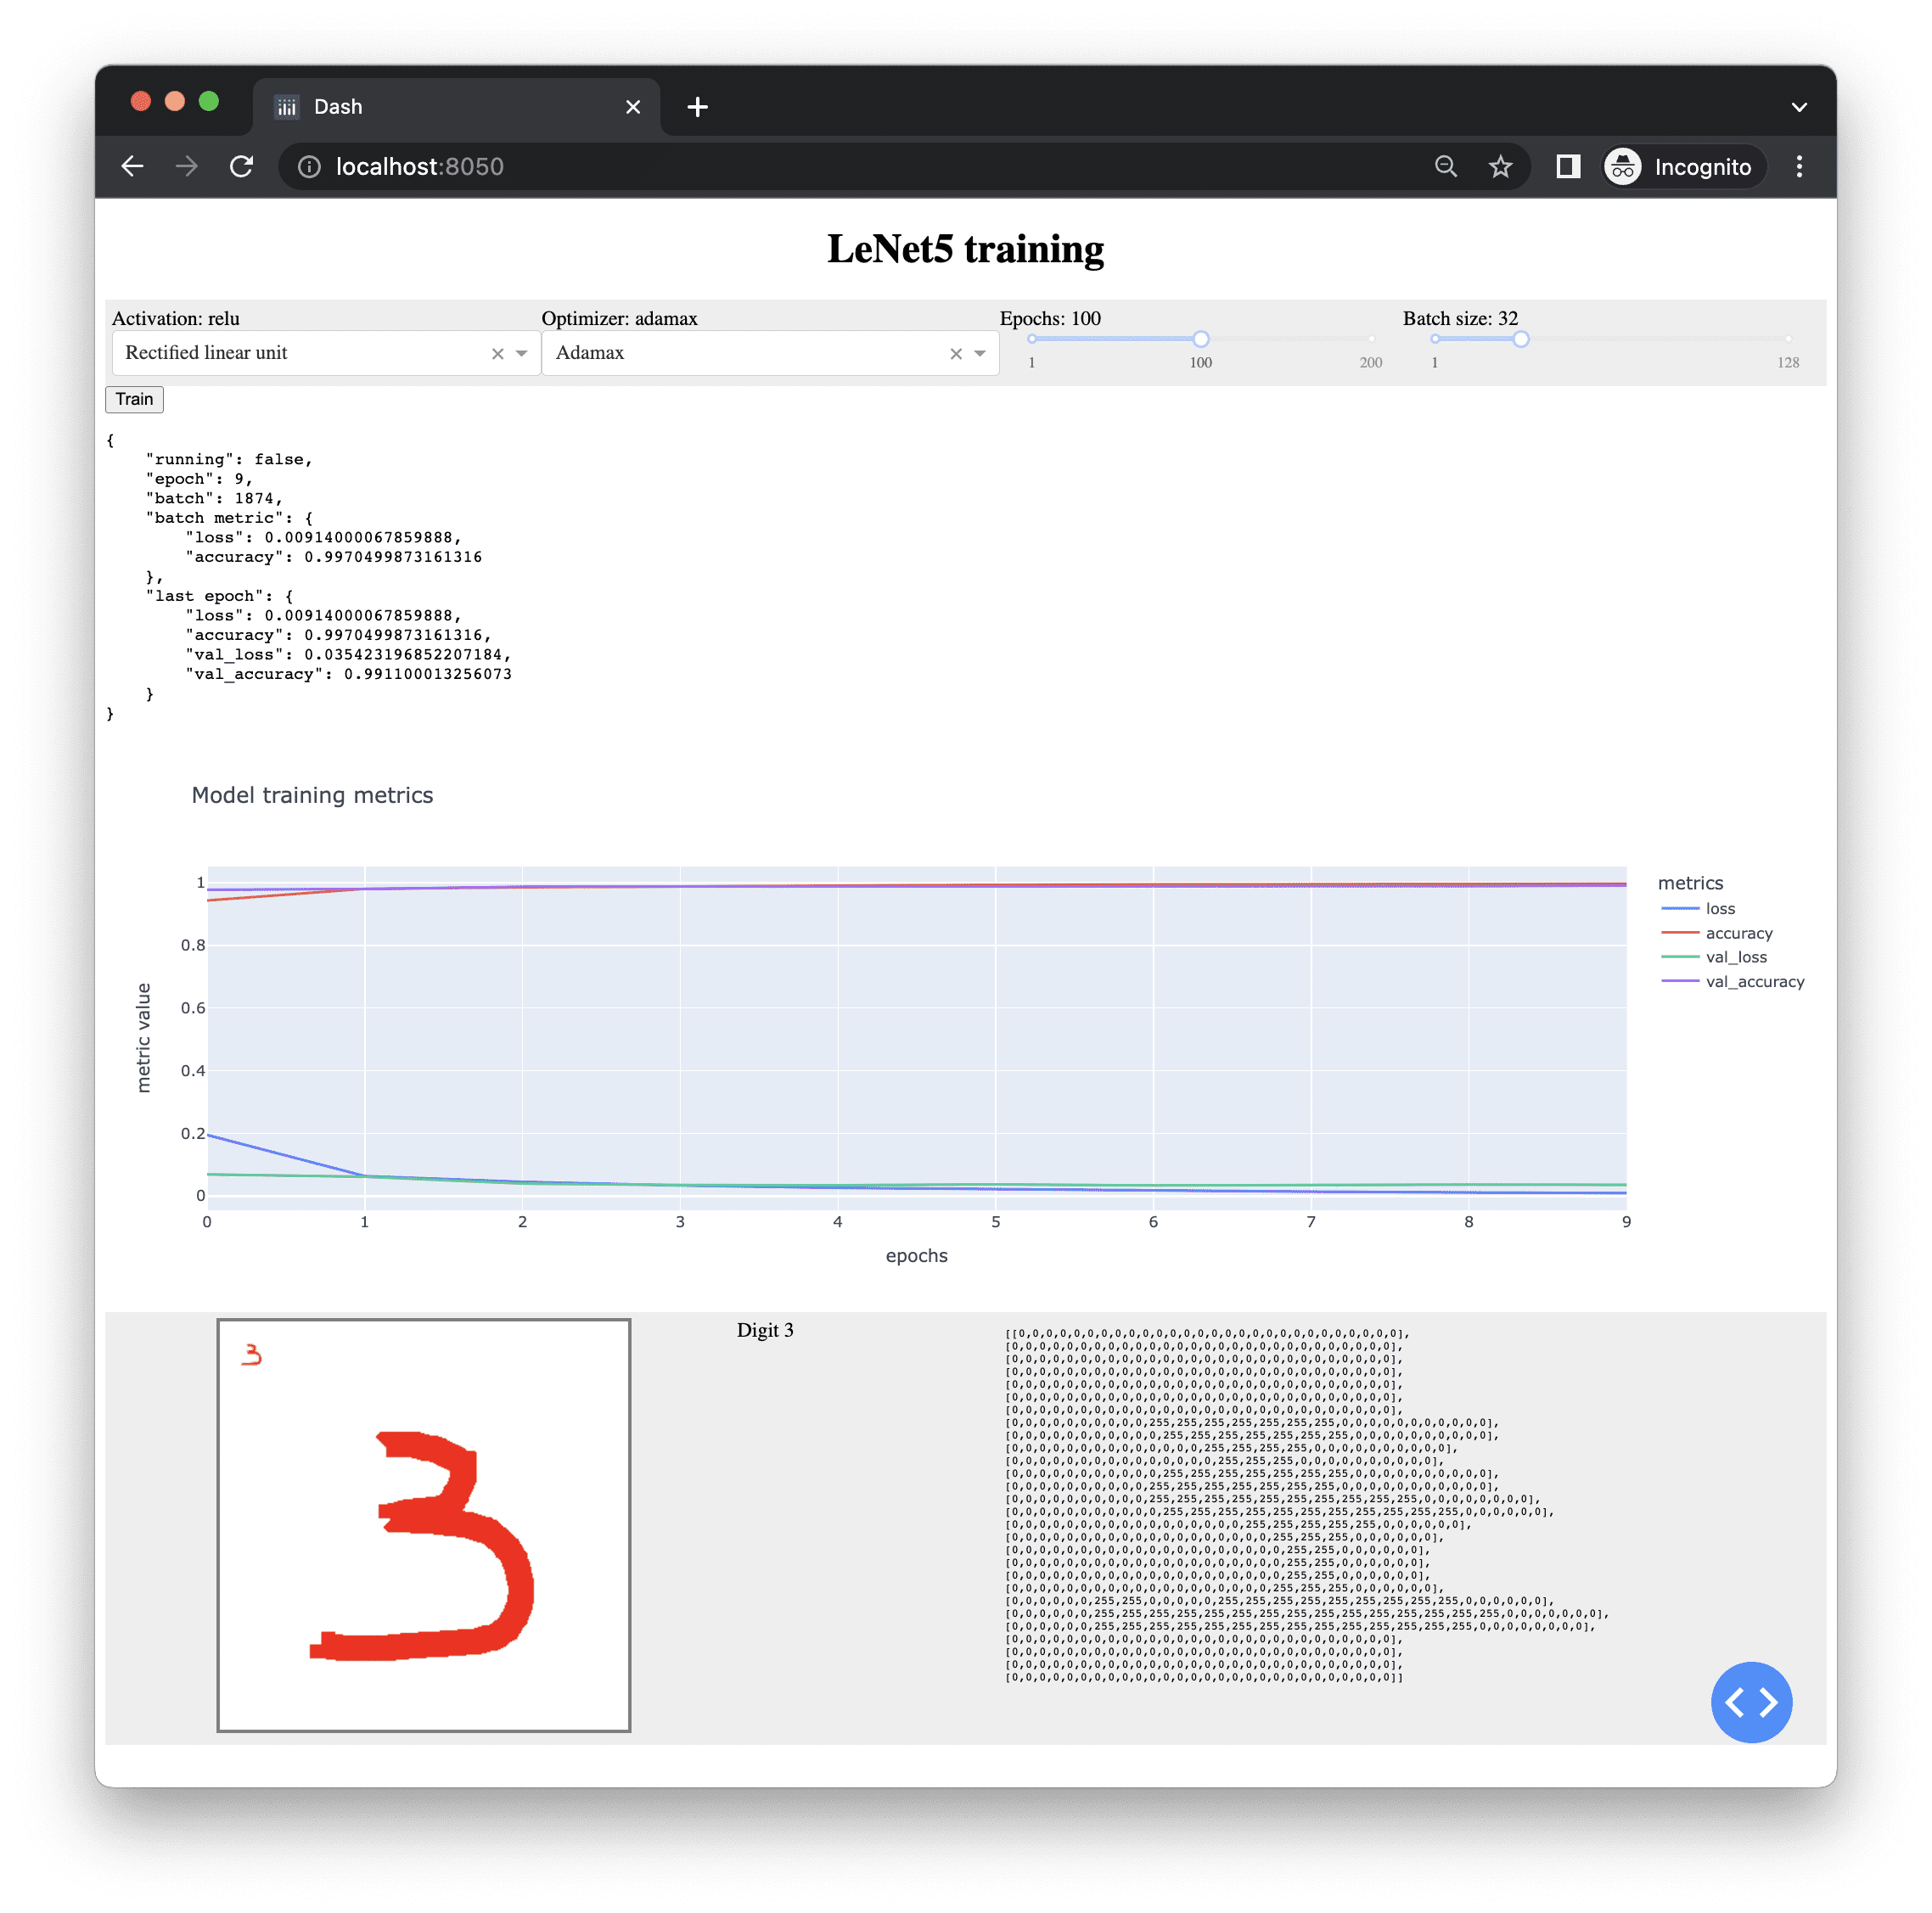
进一步阅读
市面上有大量的Web框架可供选择,Flask只是其中之一。另一个流行的框架是CherryPy。如果您想深入了解,以下是相关资源。
书籍
- Python Dash: Build Stunning Data Analysis and Visualization Apps with Plotly,作者:Adam Schroeder, Christian Mayer, 和 Ann Marie Ward
- Interactive Dashboards and Data Apps with Plotly and Dash,作者:Elias Dabbas
- Flask Web Development,第2版,作者:Miguel Grinberg
- Flask Framework Cookbook,第2版,作者:Shalabh Aggarwal
文章
- Web Frameworks,Python.org维基
API和软件
- CherryPy
- Django
- Flask
- Dash
- Plotly
- MDN JavaScript
- MDN Canvas API
- jQuery
总结
在本教程中,您学习了如何使用Dash库轻松地用Python构建Web应用程序。您还学习了如何使用Flask创建Web API。具体来说,您学习了:
- Web应用程序的机制
- 如何使用Dash构建一个由网页组件触发的简单Web应用程序
- 如何使用Flask创建Web API
- Web应用程序如何用JavaScript构建并在浏览器上运行,该浏览器使用我们用Flask构建的Web API
掌握机器学习 Python!

更自信地用 Python 编写代码
...从学习实用的 Python 技巧开始
在我的新电子书中探索如何实现
用于机器学习的 Python
它提供自学教程和数百个可运行的代码,为您提供包括以下技能:
调试、性能分析、鸭子类型、装饰器、部署等等...


精彩的帖子,Adrian!喜欢客户端回调和间隔。继续加油,团队!
嘿,Adrian
最终结果确实令人惊叹。但解决方案的复杂性相当高!!!需要学习的东西太多了,超出了数据科学家/分析师的日常知识范畴。
Dash/Plotly是一个著名的组合——但它们似乎“过于强大”——就像你将Django比作Web框架一样。
所以,在这个类比中,“Flask”版本(简单、轻量级的实现)就是Streamlit。
我过去使用过它,它抽象了所有底层的HTML标签/概念。非常易于使用且功能丰富——开箱即用就具有美观的样式和有用的组件。
布局默认是垂直的——但他们曾计划允许更灵活/自定义。
内容很棒!如果能看到这个解决方案的实现比较:dash vs Streamlit,那就太好了。
祝好!
谢谢Adrian!非常信息丰富。
我只需要更改html和dcc的导入,但仍然收到错误。
回溯(最近一次调用)
文件“~~~path~~~.server.py”,第133行,在
dcc.Slider(1, 200, 1, marks={1: “1”, 100: “100”, 200: “200”},
文件“~~~root~~~\Anaconda3\lib\site-packages\dash\development\base_component.py”,第366行,在 wrapper
return func(*args, **kwargs)
TypeError: __init__() got multiple values for argument ‘marks’
如果注释掉这些dcc.Sliders,(127.0.0.1:port)会持续更新页面而没有任何输出,即空白页面。